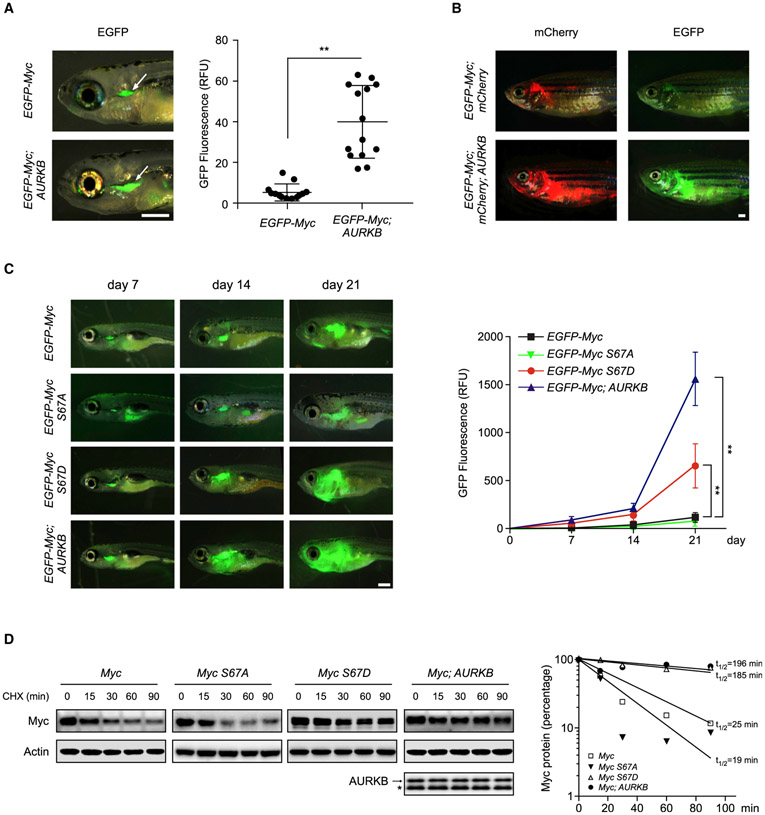
Figure 5. AURKB Promotes Murine Myc-Induced T-ALL.
(A) Zebrafish embryos were injected respectively with the rag2:EGFP-Myc construct alone or in combination with rag2:AURKB. Representative images of GFP fluorescent microscopy analysis at 8 dpf are shown on the left. GFP fluorescence from the thymuses of EGFP-Myc (n = 13) and EGFP-Myc;AURKB fish (n = 14) were qualified and plotted on the right. Scale bar, 1 mm. Data are means ± SD, **p < 0.01, unpaired two-tailed Student’s t test.
(B) Representative images of GFP or mCherry dissemination at 80 dpf in EGFP-Myc;mCherty (n = 10) and EGFP-Myc;mCherry;AURKB (n = 12) transgenic fish receiving heat shock treatments. Scale bar, 1 mm.
(C) Representative GFP images of zebrafish injected with indicated constructs (left). Scale bar, 1 mm. Quantifications of the GFP fluorescence are shown on the right (n = 6 in each group). Data are mean ± SD, **p < 0.01, two-way ANOVA test followed by Tukey’s correction.
(D) Time-course analysis of exogenous murine Myc from zebrafish expressing various transgenes as indicated. The arrow denotes human AURKB transgene expression and the bands below (*) are endogenous zebrafish Aurkb. Zebrafish Actin was used as a loading control (left). Myc protein levels at each point were quantified and plotted on the right.
See also Figure S4.

