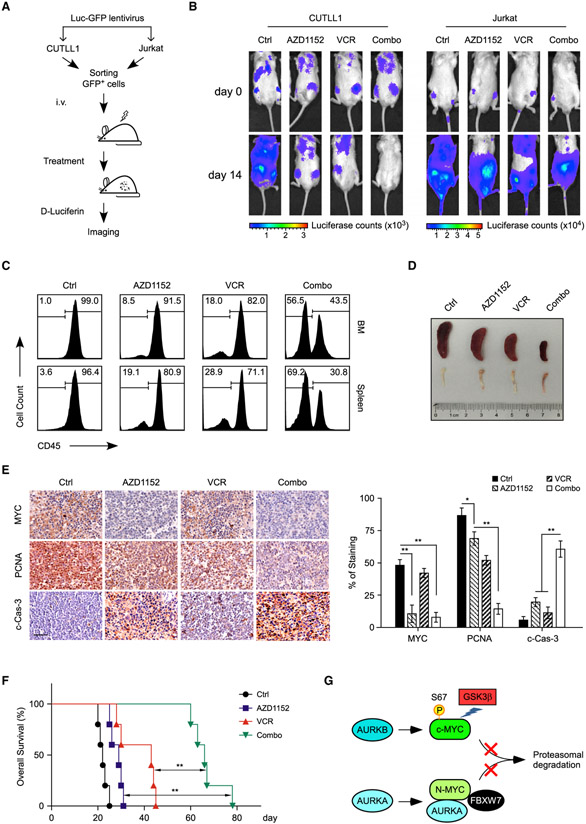
Figure 7. AZD1152 and Vincristine Synergistically Inhibit Xenograft Tumor Growth.
(A) Schematic representation of in vivo imaging of T-ALL xenografts. CUTLL1 (FBXW7 WT) or Jurkat (FBXW7 Mut) cells, expressing both luciferase and GFP markers (Luc-GFP), were injected into NPG mice and subjected to treatments, followed by in vivo bioimaging to assess therapeutic responses.
(B) Representative images of tumor burden assessed by bioimaging in mice xenografted with CUTLL1 or Jurkat cells upon single or combination treatments (n = 3 per group). Drug administrations started at day 0.
(C) Anti-leukemia effects of drug combination in a patient-derived xenograft (PDX). Human CD45+ cells from bone marrow (BM) and spleen were analyzed by flow cytometry.
(D) Representative spleen and bone images of mice in each group at day 25 after engraftment.
(E) Representative immunohistological images of MYC, proliferating cell nuclear antigen (PCNA), and cleaved caspase-3 (c-Cas-3) in the spleen sections from mice receiving indicated treatments. Scale bar, 50 μm. Quantifications of immunohistochemistry are shown on the right. Data are mean ± SD, *p < 0.05, **p < 0.01, one-way ANOVA test followed by Tukey’s correction.
(F) Kaplan-Meier survival curves of T-ALL PDX treated with AZD1152 and/or vincristine (n = 5 in each group). Significance was determined by logrank test, **p < 0.01.
(G) Model depicting the regulation of (c-)MYC or N-MYC by Aurora kinases through kinase-dependent or independent mechanism. See text for more details.

