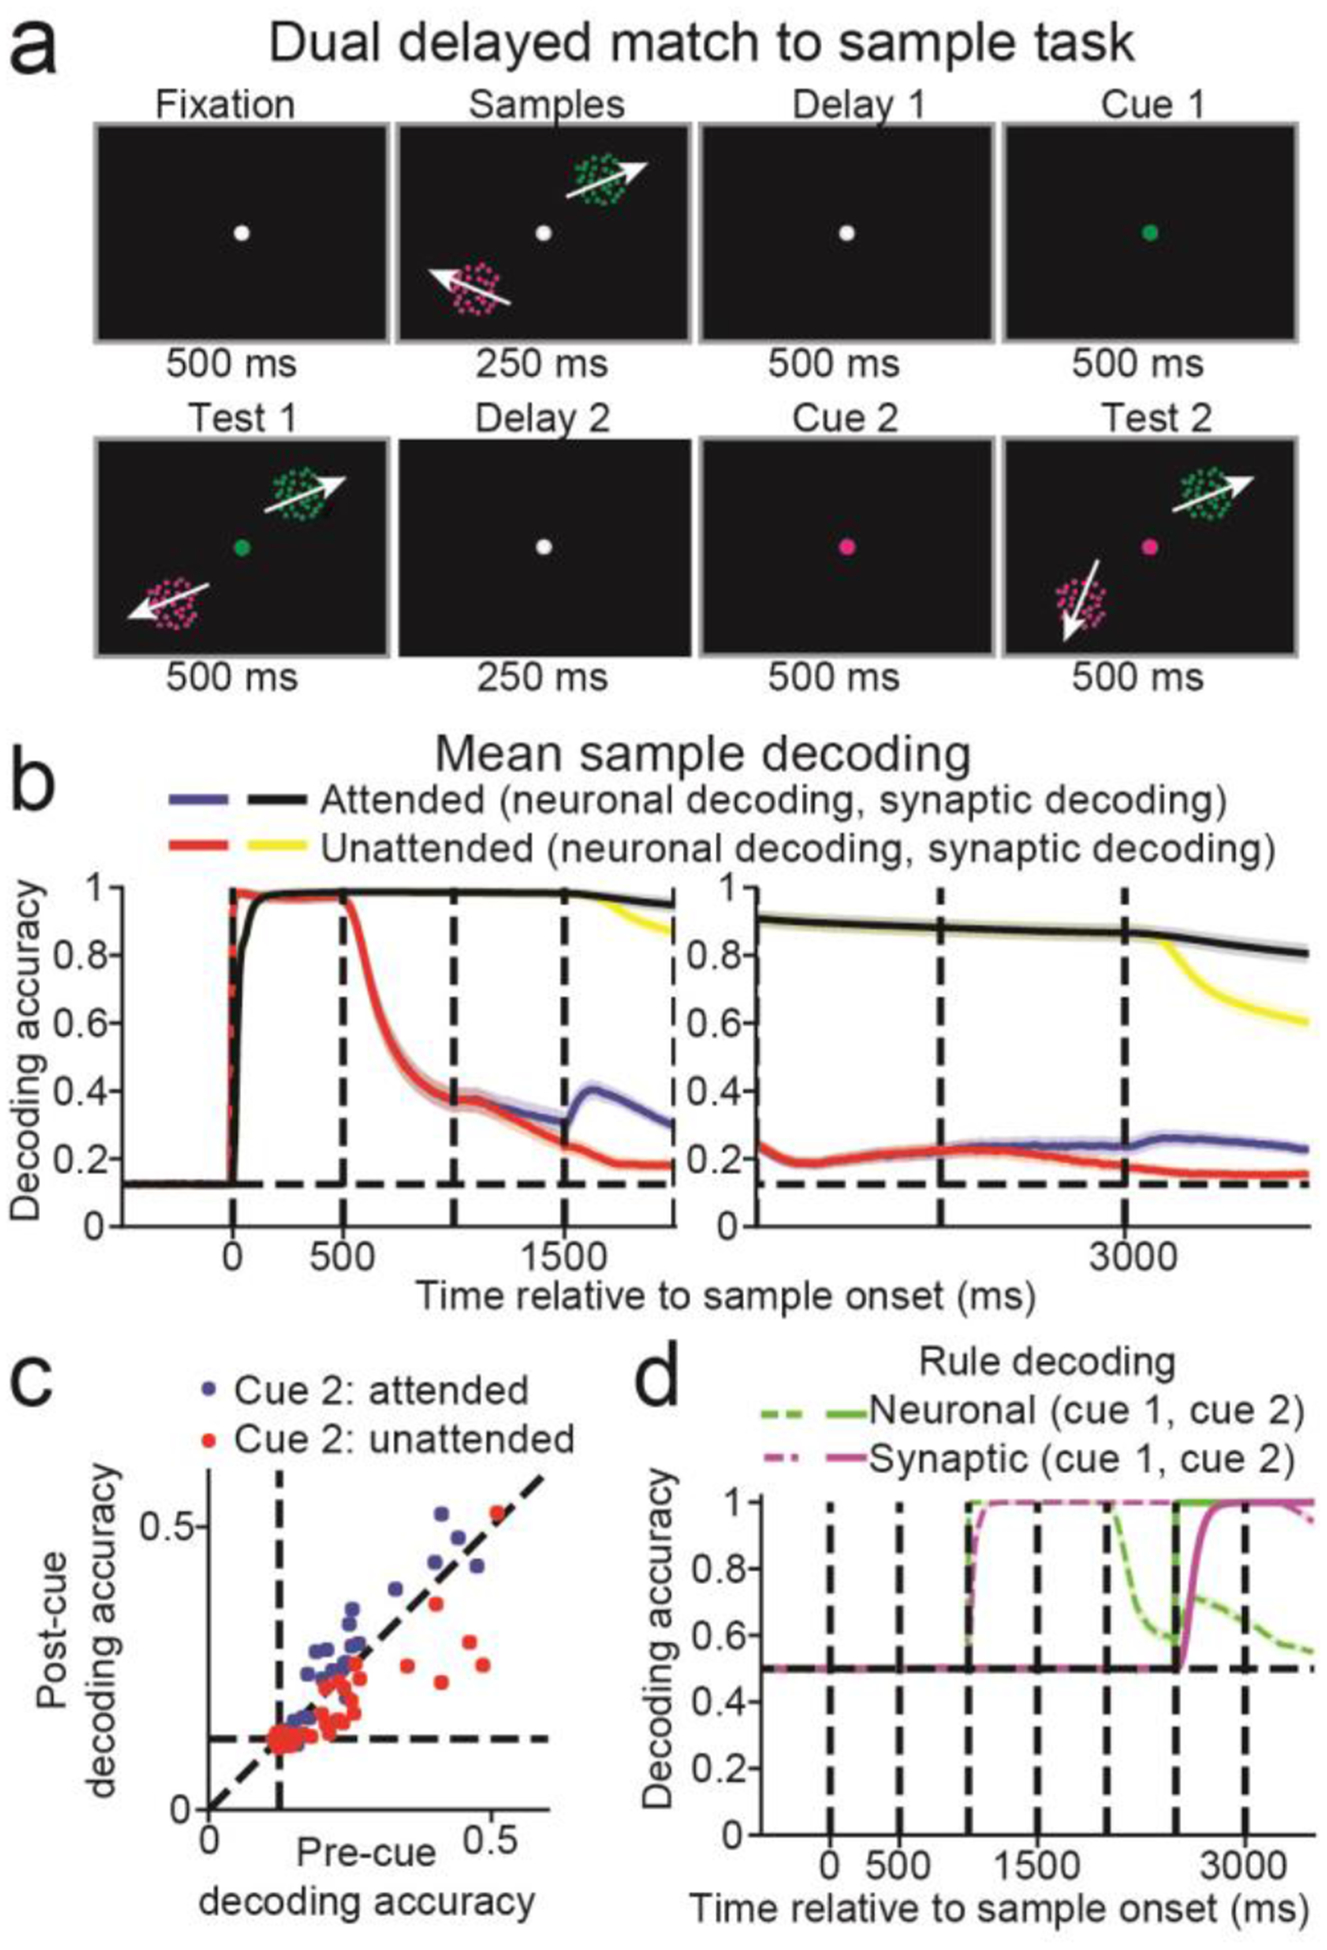
Figure 6. Dual delayed match-to-sample task.

(a) Two sample stimuli were simultaneously presented for 500 ms. This was followed by a 1000 ms delay in which a cue appeared halfway through, and then two simultaneous test stimuli for 500 ms. The cue indicated which of the two sample/test pairs were task-relevant. Another 1000 ms delay and 500 ms test period was then repeated, in which a second cue again indicated which of the two sample/test pairs was task-relevant. (b) Neuronal decoding accuracy for the attended (blue curve) and unattended (red) stimuli, and the synaptic decoding accuracy for the attended (black) and unattended (yellow) stimuli, are shown from trial start through the first test period (left panel), and the second delay and test periods (right panel). Decoding accuracy curves are mean values across n = 20 networks. Shaded error bars indicate one SEM. (c) Scatter plot showing the neuronal decoding accuracy, measured from 100 to 0 ms before the second cue (x-axis) against neuronal decoding accuracy, measured from 400 to 500 ms after second cue (y-axis). Blue dots represent stimuli that were unattended after the first cue, and attended after the second cue, and red dots represent stimuli that were not attended to after the first and second cues. (d) The neuronal (green) and synaptic (magenta) rule decoding accuracy. The dashed lines indicate the decoding accuracy of the first cue, and the solid lines indicate the decoding accuracy of the second cue.
