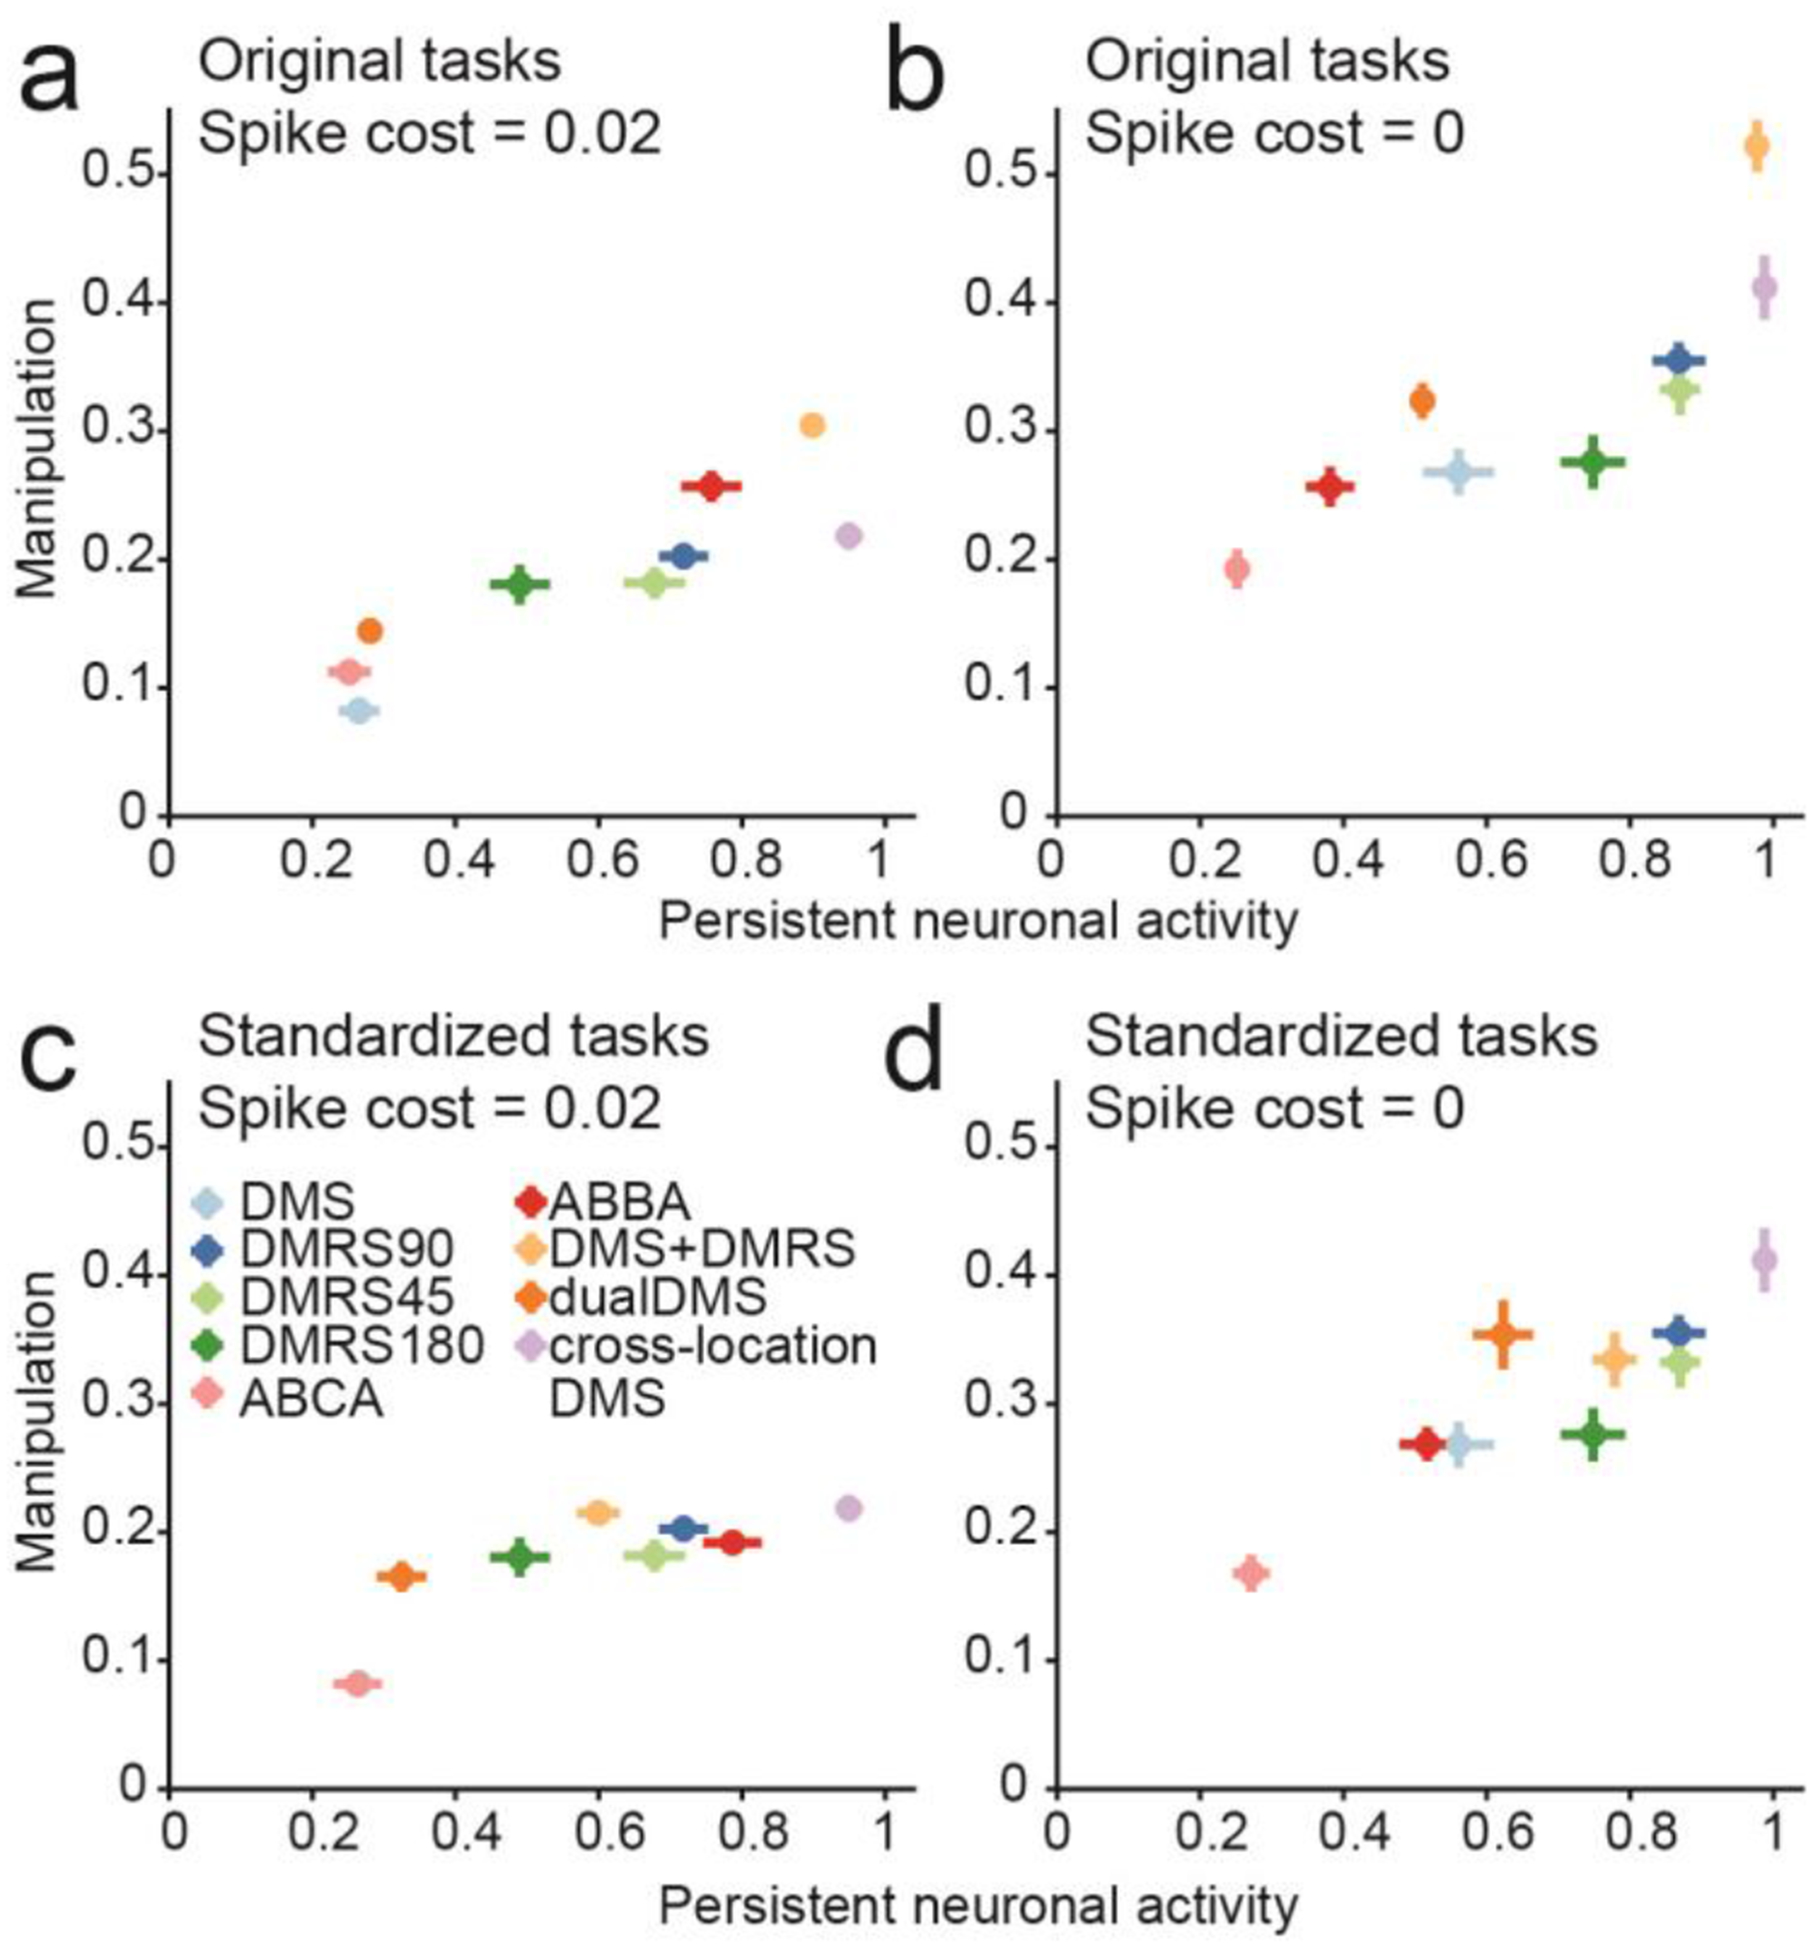
Figure 7. The relationship between manipulation and stimulus-selective persistent activity.

(a) Scatter plot shows the level of persistent neuronal activity, measured as the neuronal decoding accuracy during the last 100 ms of the delay (x-axis), versus the level of manipulation (y-axis). (b) Same as (a), except that networks were trained without the penalty on high neuronal activity. (c) Same as (a), except that persistent activity and task manipulation were measured by presenting all networks with a standard 500 ms motion stimulus followed by a 1000 ms delay. (d) Same as (c), except for networks trained without the penalty on high neuronal activity. (a-d) Center of each dot represents the mean value across n = 20 networks trained on one specific task. Error bars represent one SEM.
