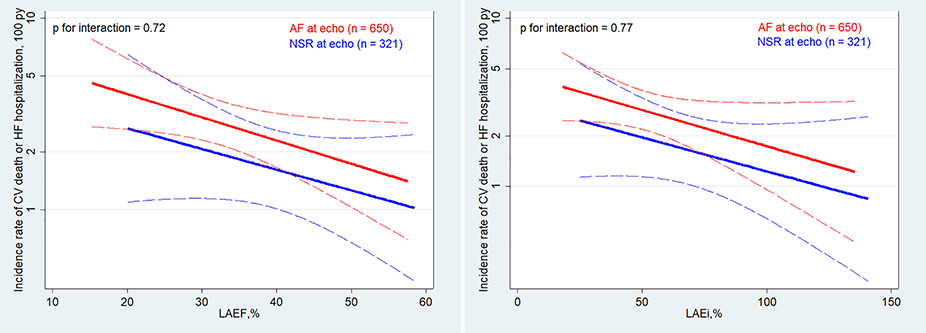
Figure 3.
Adjusted association between left atrial emptying fraction (LAEF) and left atrial expansion index (LAEi) and the composite endpoint stratified by rhythm at the time of echocardiography (atrial fibrillation [AF] vs. normal sinus rhythm [NSR]). The red and blue lines represent an estimation by Poisson regression of the association between LAEF and LAEi and the outcome stratified by cardiac rhythm at the time of echocardiography after adjusting for age, sex, diabetes, heart rate, history of heart failure (HF), history of myocardial revascularization, AF pattern, allocated therapy, left ventricular (LV) end-diastolic volume index, LV mass index, LV ejection fraction and E/e′. Dashed lines represent 95% confidence intervals. Incidence rates are displayed on the y-axis. P-values refer to interactions between the two groups. CV, cardiovascular; py, person-years.

