Figure 2.

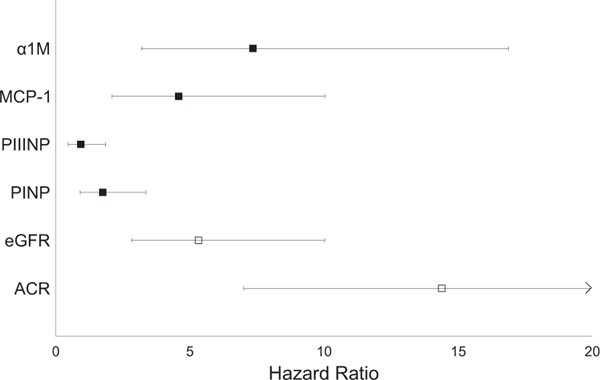
Association with allograft failure of quartile 4 versus quartile 1 of each marker. Point estimates reflect the highest versus lowest quartile of the marker, with the exception of estimated glomerular filtration rate (eGFR), for which the lowest (worst kidney function) is compared to the highest quartile. All models are adjusted for urine creatinine, age, sex, race, country, FAVORIT (Folic Acid for Vascular Outcome Reduction in Transplantation) randomization group, diabetes, systolic blood pressure, cardiovascular disease, smoking, time since transplantation, living donor status, eGFR, and urine albumin-creatinine ratio (ACR), corresponding to model 2 from Table 3. For eGFR, individuals in quartile 4 had eGFRs < 33 mL/min/ 1.73 m2, and those in quartile 1 (reference category) had eGFRs ≥ 57 mL/min/1.73 m2. For urine ACR, individuals in quartile 4 had urine ACRs ≥ 105 mg/g, and those in quartile 1 (reference category) had urine ACRs < 10 mg/g. Error bars reflect 95% confidence interval limits. For ACR, the upper bound of the 95% confidence interval is truncated for improved visual appearance of the other markers; the upper limit of the 95% confidence interval is at 29.5. Abbreviations: α1M, α1-microglobulin; MCP-1, monocyte chemoattractant protein 1; PINP, procollagen type I; PIIINP, procollagen type III.
