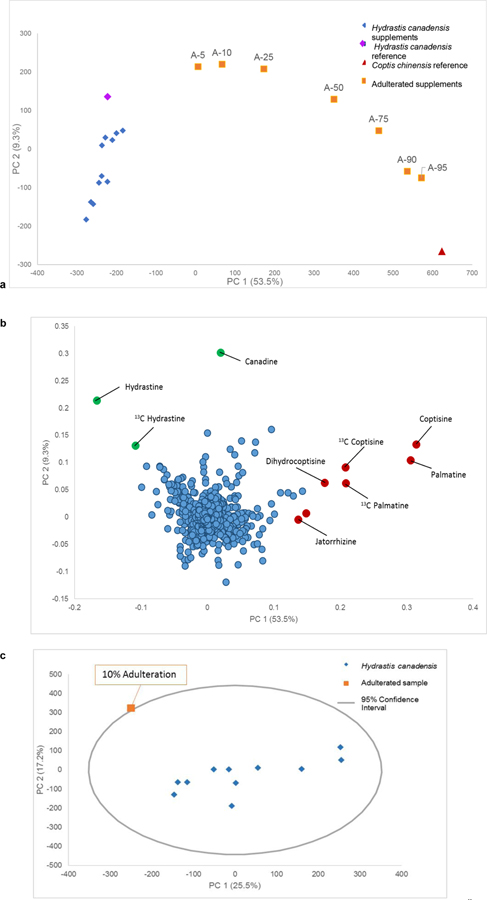
Fig. 2:
Principal component analysis (PCA) scores plot (a), PCA loadings plot (b), and Hotelling’s T2 95% confidence interval (c) from the LC-MS data. The points in the scores plot are labeled to indicate the percentage of adulterant (Coptis chinensis) added to the Hydrastis canadensis plant material (A-5 is 5% C. chinensis, 95% H. canadensis, A-10 is 10% C. chinensis, etc.). Similar variance was showcased with a PC 1 (53.5%) versus PC 2 (9.3%) comparison of the LC-MS data for a total of 62.8% variance. The red triangle denotes the reference material for C. chinensis, while the purple diamond represents the reference material for H. canadensis. In the loadings (b) each data point represents a feature (a unique m/z value-retention time pair) detected in the sample. Variables in red are associated with Coptis chinensis, while those in green are associated with Hydrastis canadensis. The 95% confidence interval (c) was applied to PCA analysis of the goldenseal samples with only a single adulterated sample included in the dataset. The inclusion of just one outlier improves the ability to detect outliers as compared to datasets where multiple outliers were included (ESM, Fig. S3). At 5% adulteration the sample was not an outlier however, at 10% adulteration the sample was beyond the confidence interval and became a visible outlier.

