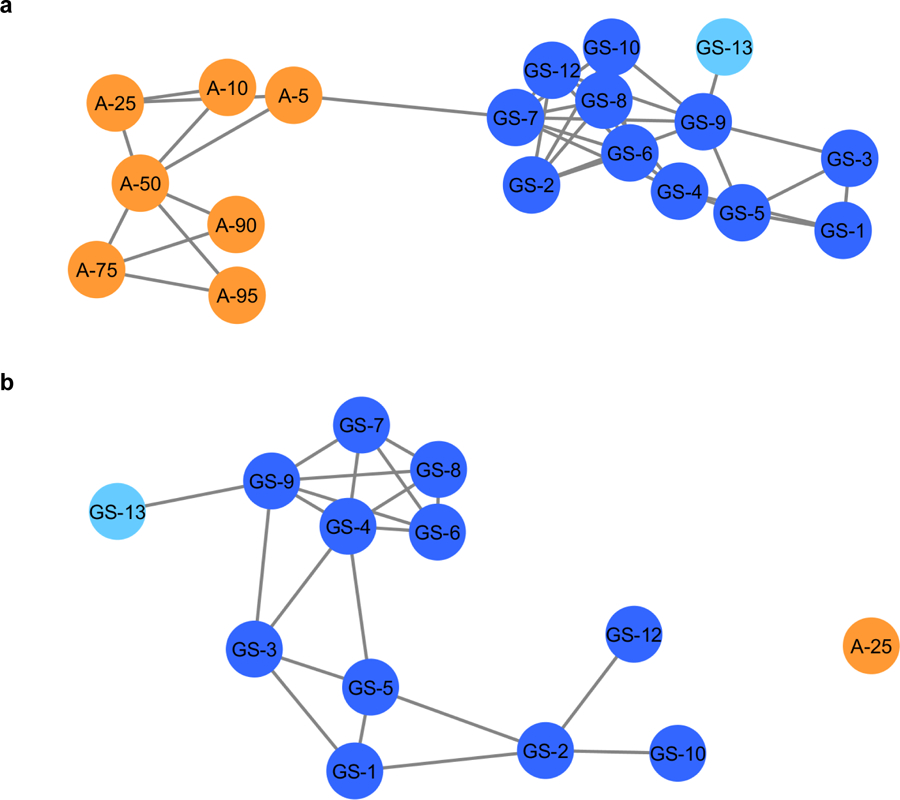
Fig. 4:

Composite score analysis of the entire sample set, a, (ESM, Tables S1 and S2) and composite score analysis with 25% adulterated product (b). The adulterated samples, in orange, are separated from the goldenseal commercial samples (in blue). The light blue node represents the goldenseal vouchered reference material. The connected lines represent a similarity score of >0.3, the highest score being 1.0. In the composite score analysis of the authentic supplements versus the 25% adulterated product (b) a similarity score range of 0.10–1.0 was applied. The 25% adulterated product (orange) is no longer connected to the other nodes (blue).
