
Figure 3.
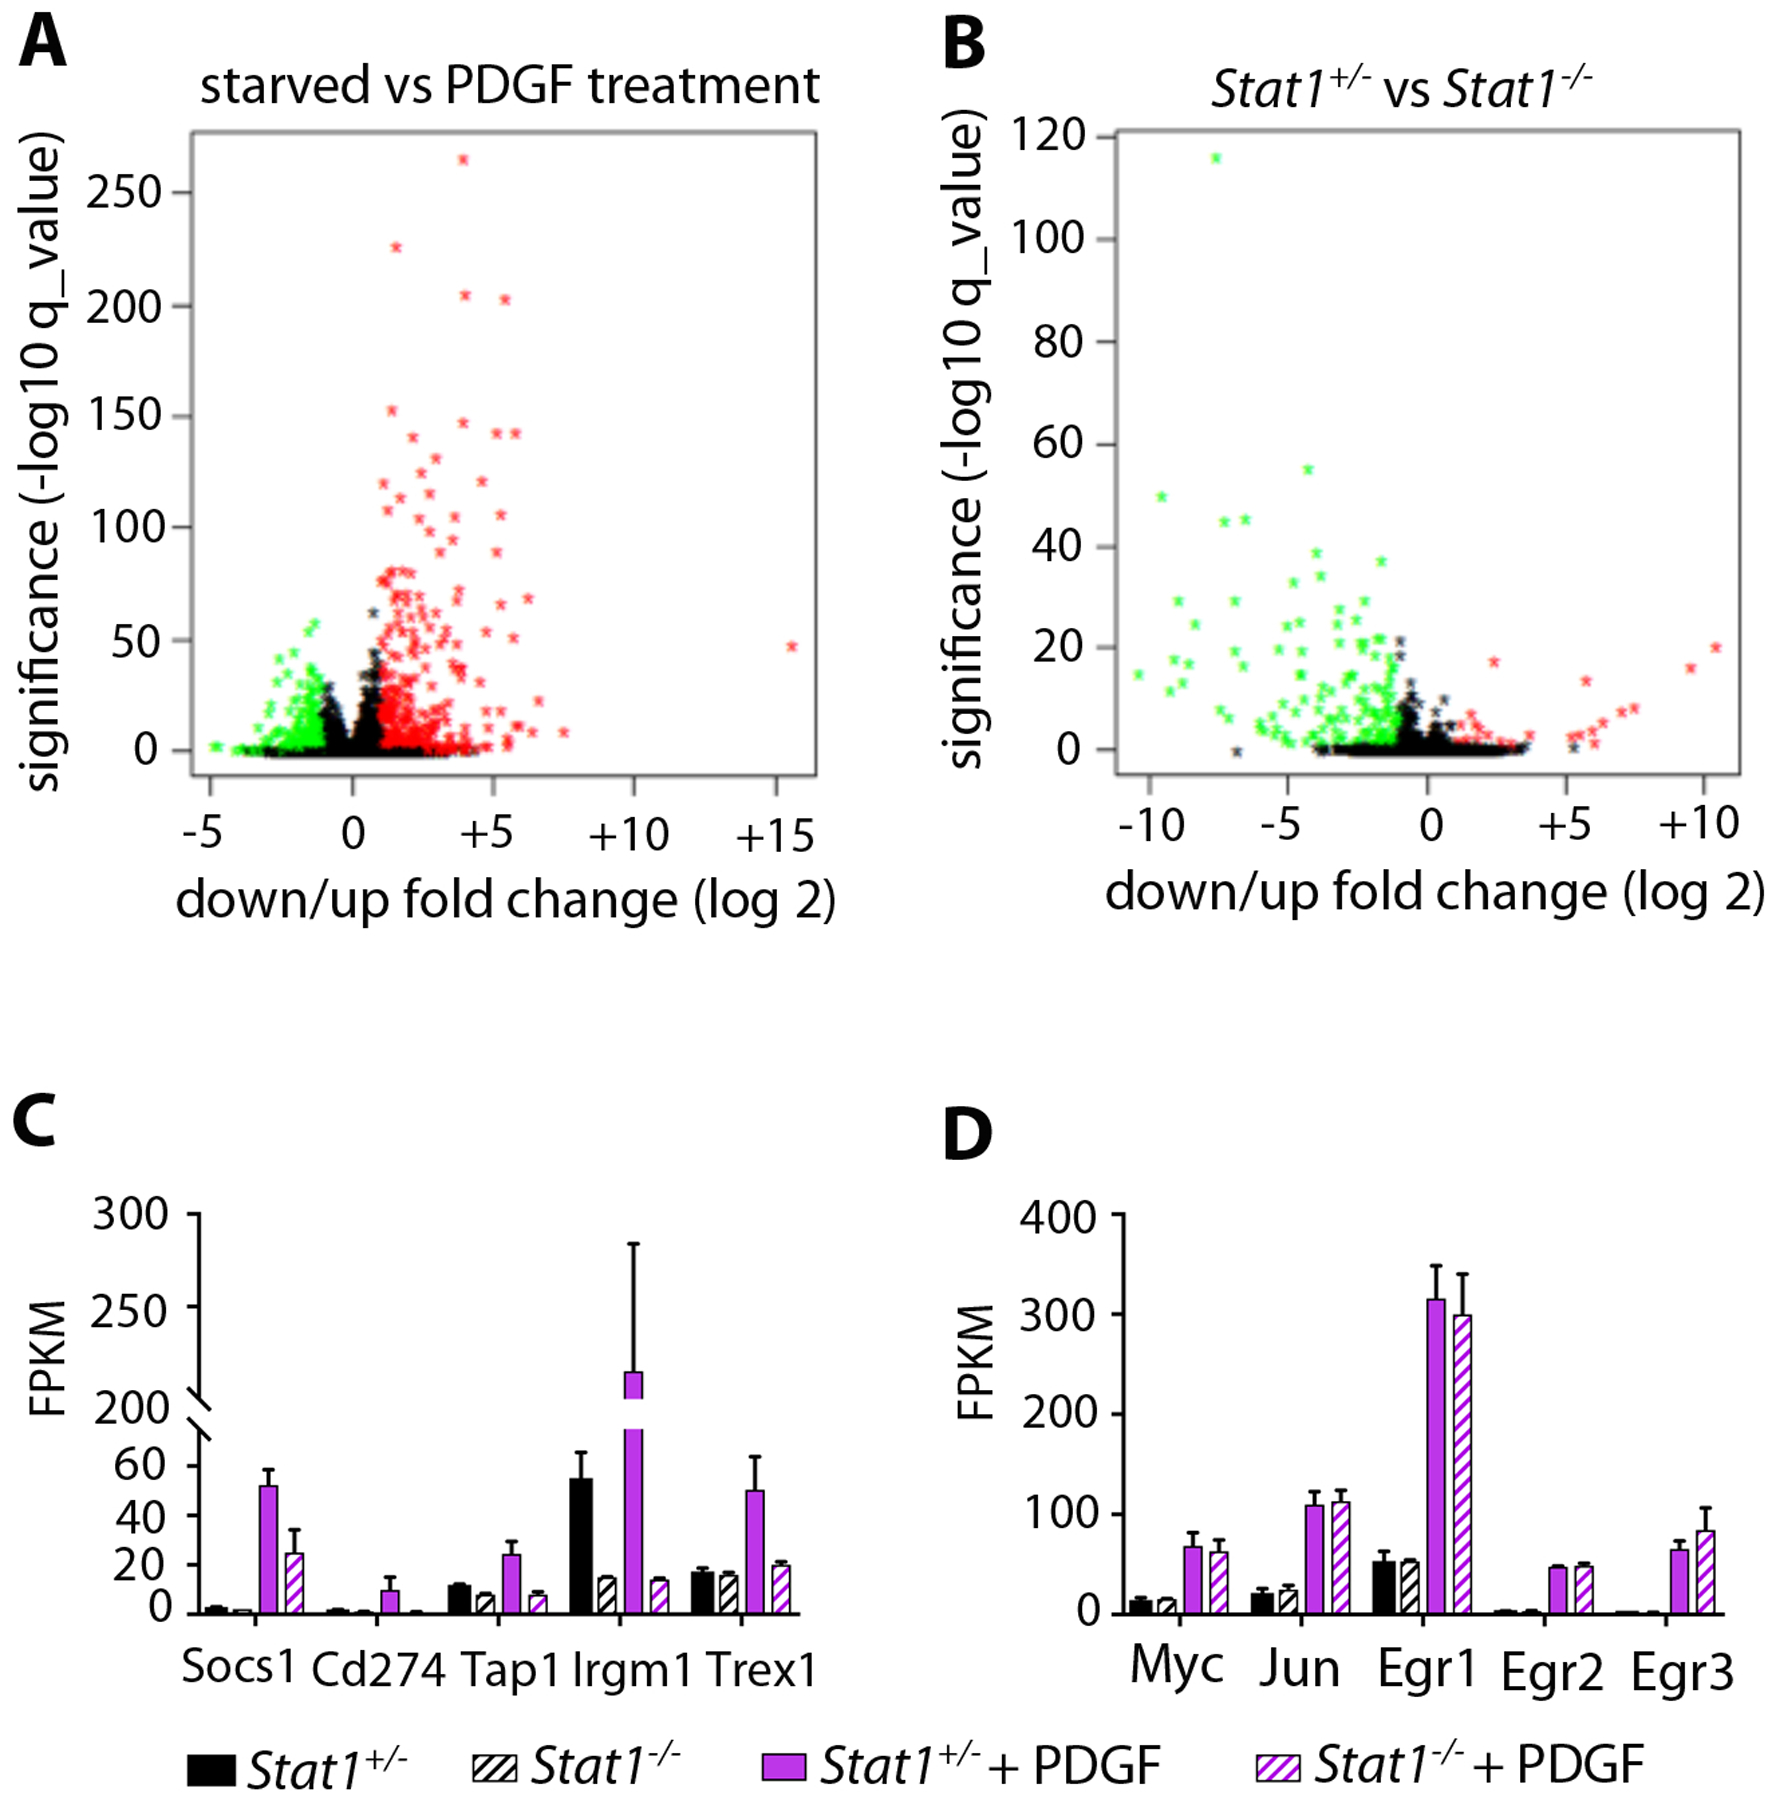
Stat1 mediates growth factor activation of ISGs but not IEGs. (A) Volcano plot showing all gene expression changes in serum-starved DFs after treatment with PDGF-BB for 1 hour, determined by RNA sequencing. Fold change in expression is shown on the X-axis, versus significance shown on the Y-axis. Upregulated genes are red, downregulated genes are green. PDGF treatment primarily causes gene upregulation. (B) Volcano plot showing gene expression changes in Stat1−/− DFs relative to Stat1+/− DFs, with axes and colors the same as A. Stat1-deficiency primarily causes gene downregulation. (C) Normalized transcript expression levels of PDGF-induced/Stat1-dependent ISGs as determined by RNA sequencing from n = 2 biological replicates per treatment group, +/−SD. (D) Normalized transcript expression levels of PDGF-induced/Stat1-independent IEGs as determined by RNA sequencing from n = 2 biological replicates per treatment group, +/−SD.