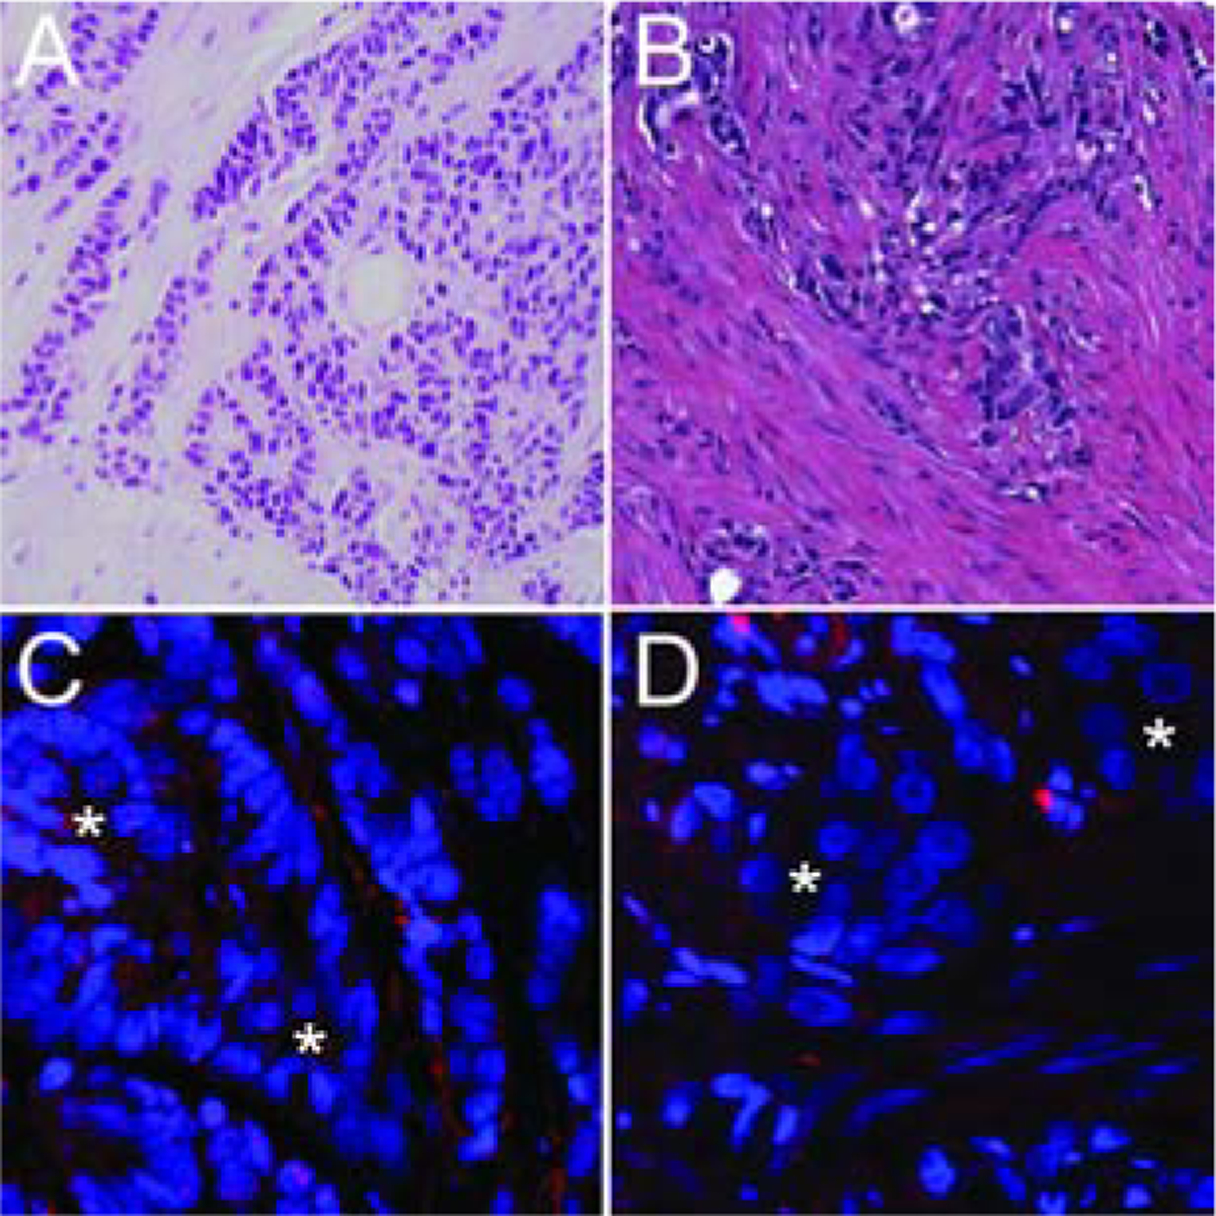
Figure 1. Telomere length analysis by FISH.

(A, C) A small cell carcinoma case shows extremely bright telomere signals (indicative of longer telomeres) in the cancer cells (*) when compared to the surrounding benign stroma. (B, D) In contrast, this representative adenocarcinoma case shows greatly reduced telomere signals in the cancer cells (*) as compared to the surrounding benign stroma. The centromere DNA, stained with the FITC-labeled centromere-specific peptide nucleic acid probe, has been omitted from the image to emphasize the differences in telomere lengths. Original magnification × 400.
