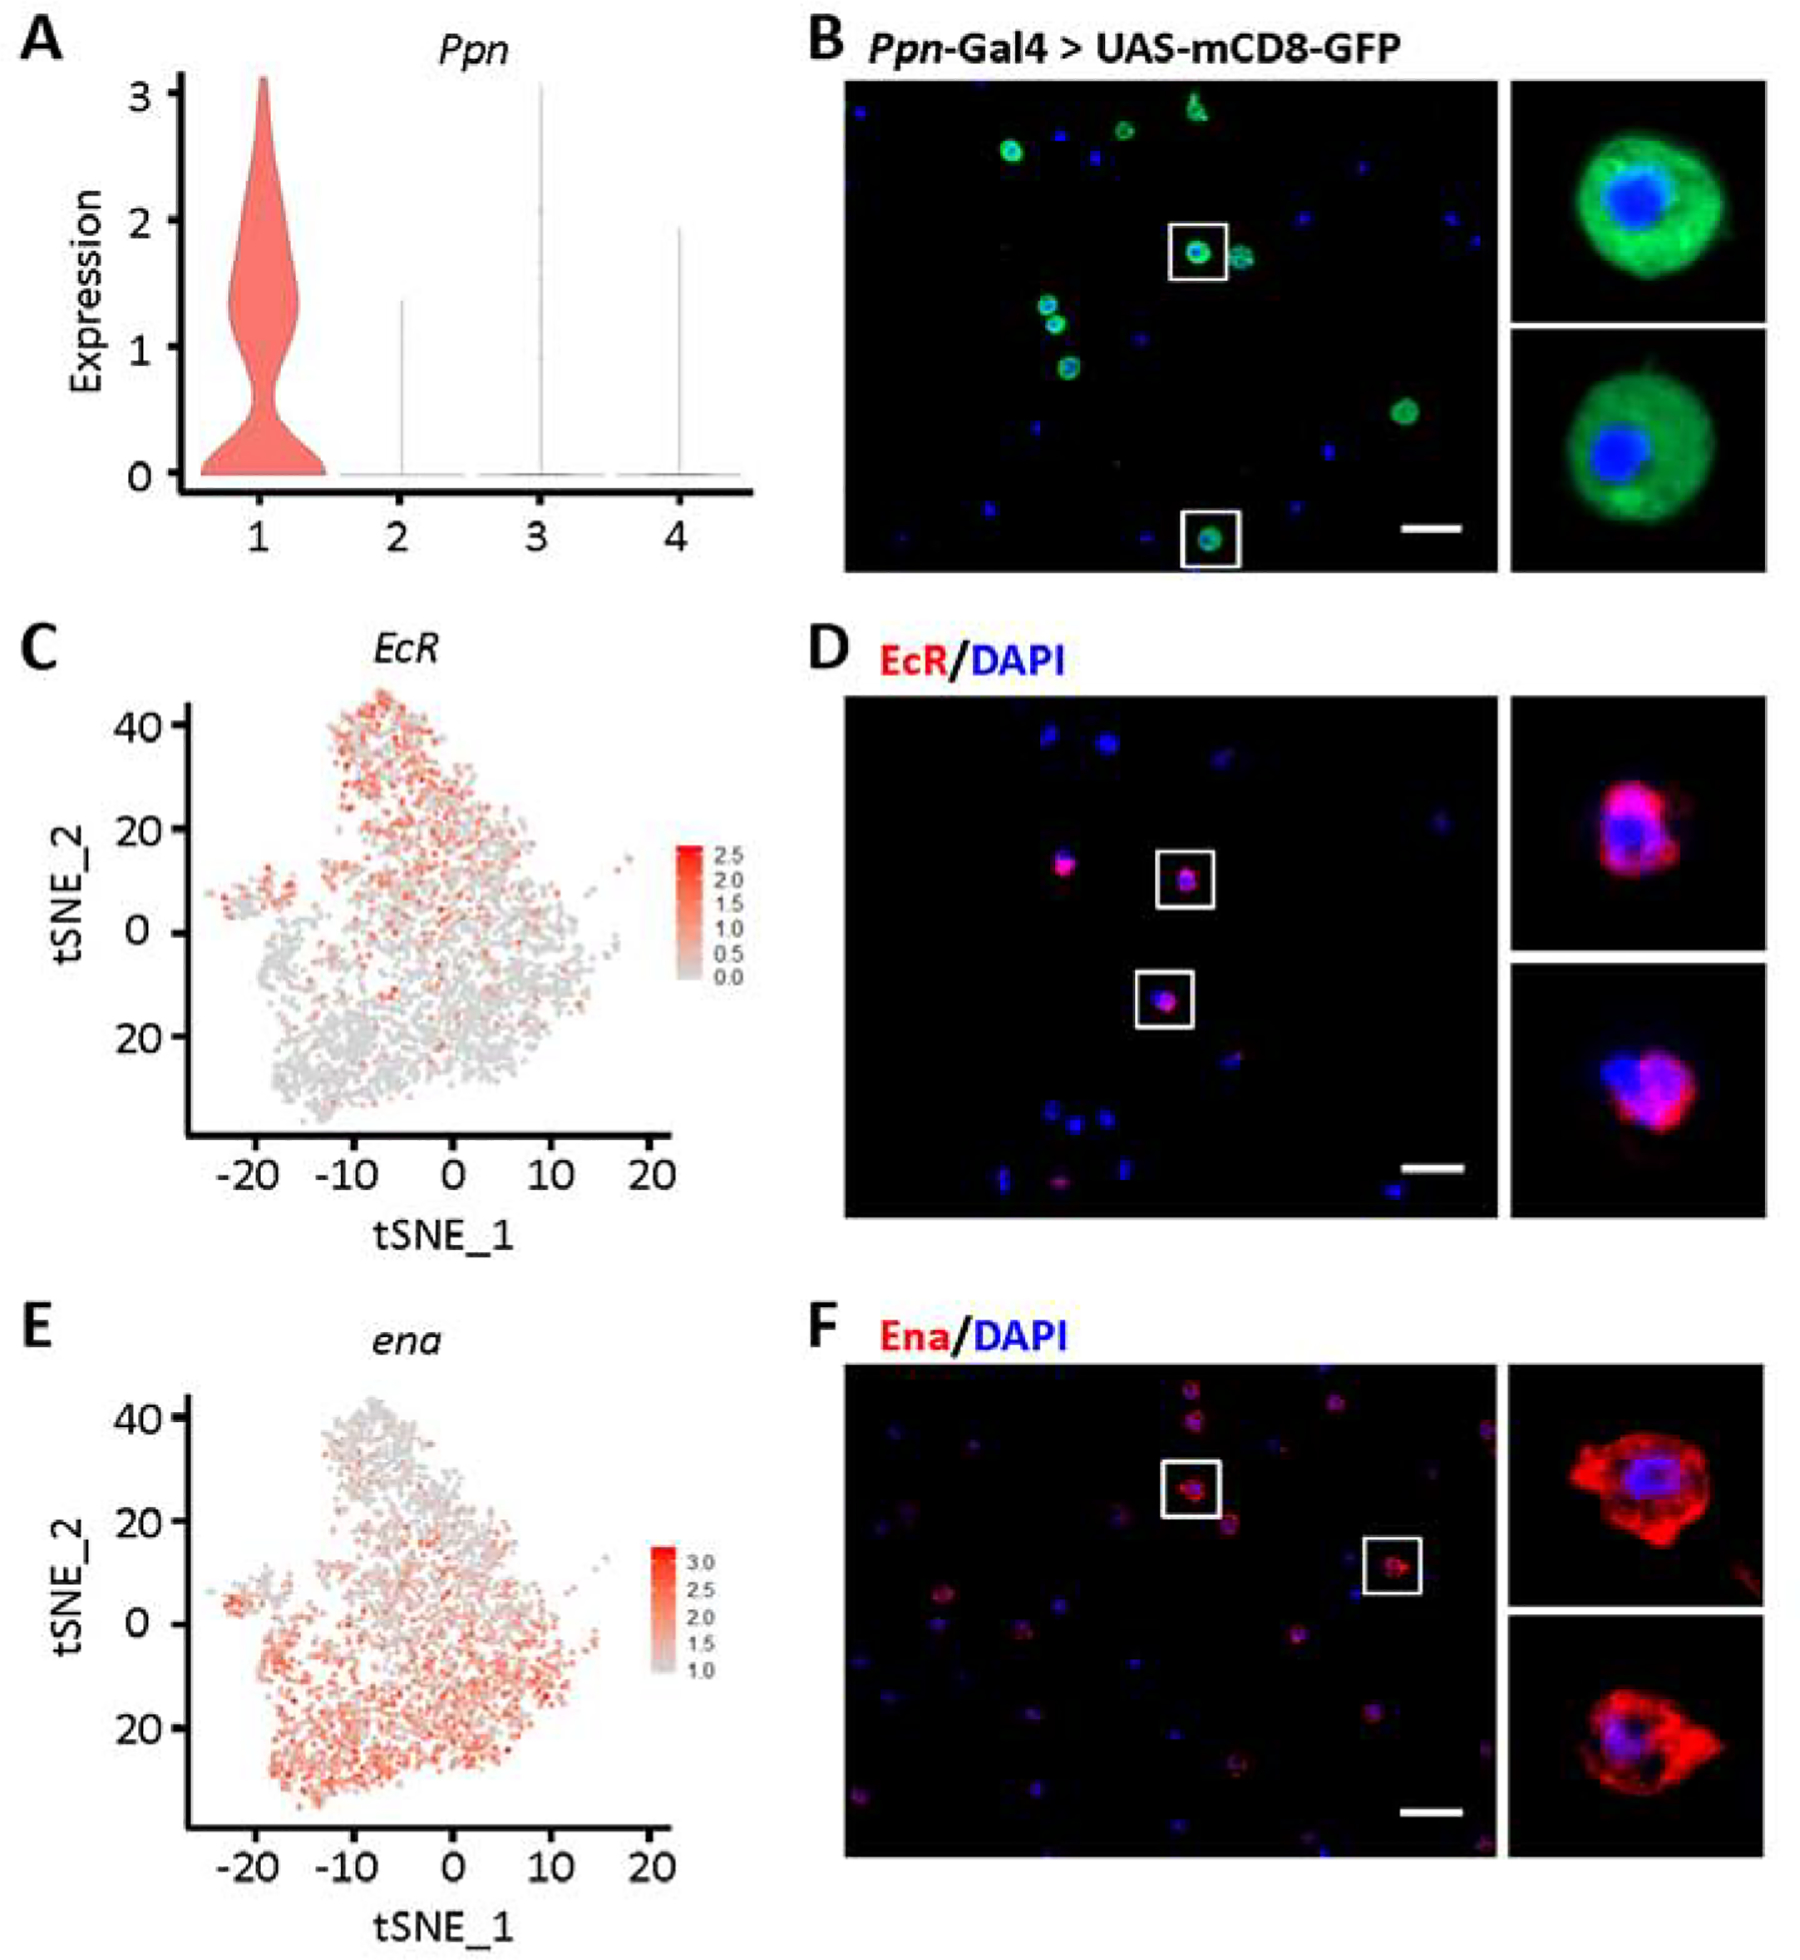
Fig. 3.

Labeling of Ppn+ and CAH7+ plasmatocytes by differentially expressed markers. A: Violin plot showing Ppn expression in plasmatocyte subclusters. Y-axis: log scale normalized read count. X-axis: 1: Ppn+ PM; 2: CAH7+ PM; 3: Lsp+ PM; 4: reservoir PM. B: Representing Apotome image of Ppn expression (green) in blood cells from Drosophila mCD8-GFP driven by Ppn-Gal4. Nuclear counterstain with DAPI (blue). Scale bar: 20 μm. C and E: Feature plots representing expression (level and distribution) in plasmatocytes for EcR (C) and ena (E). D and F: Representing Apotome images EcR (D; red) and Ena (F; red) protein expression in Drosophila blood cells, by immunofluorescence. Nuclear counterstain with DAPI (blue). Scale bars: 20 μm.
