Fig. 4.

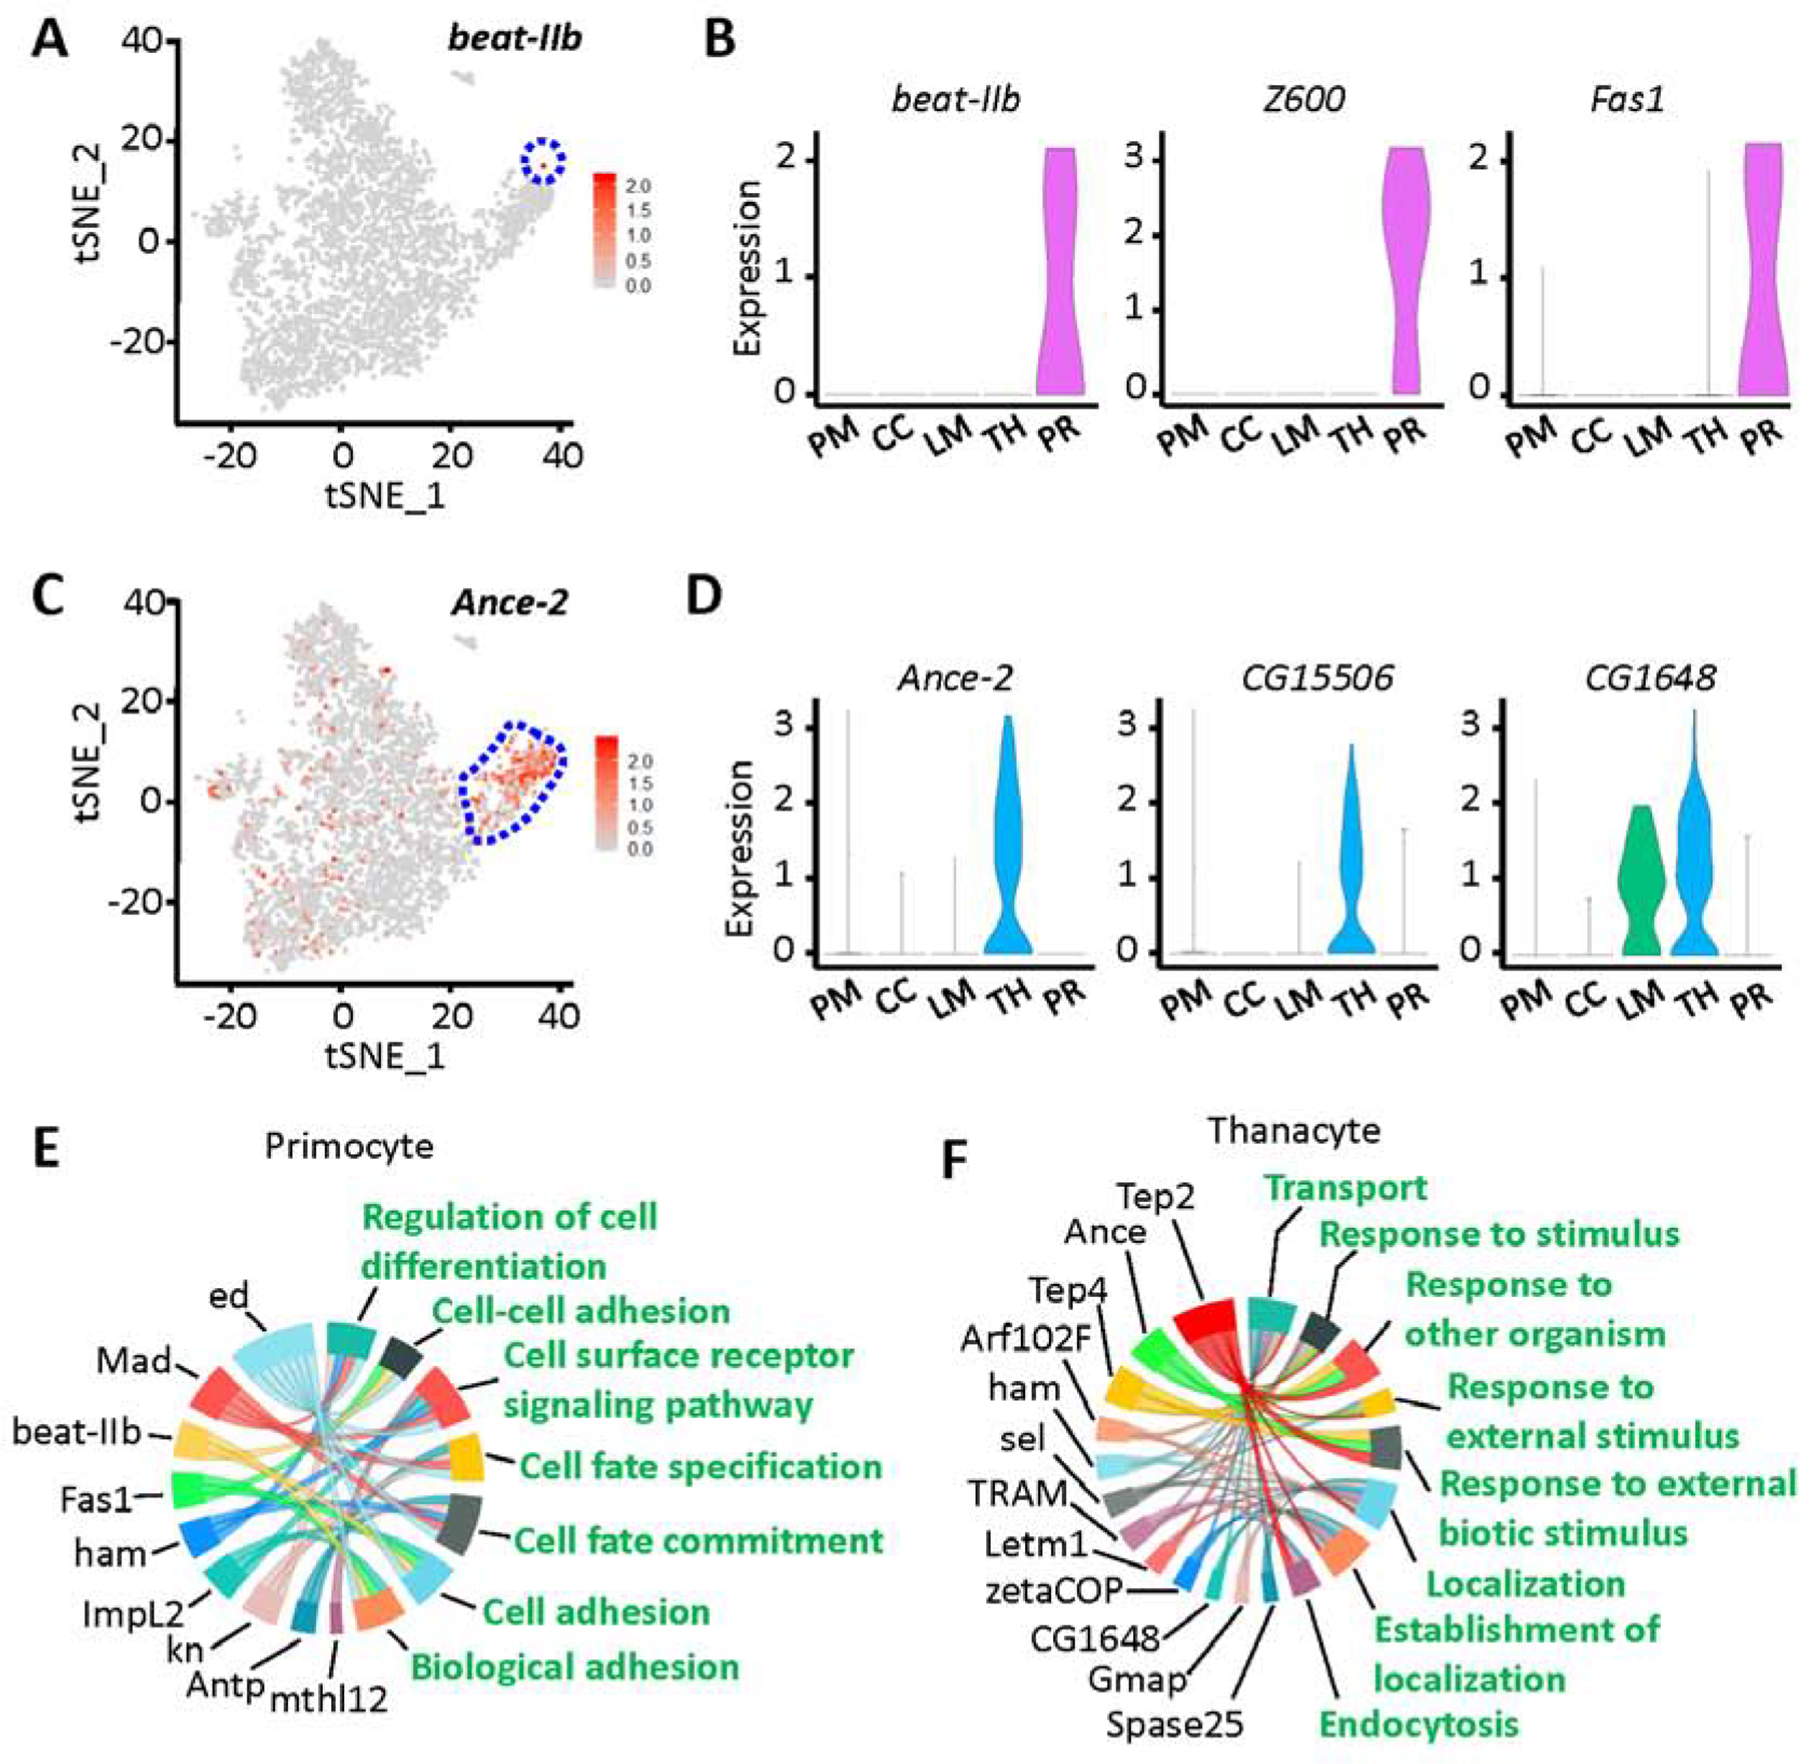
Identification of two novel cell types in Drosophila blood: thanacytes and primocytes. A: Feature plot representing beat-IIb gene expression in hemocytes (scRNA-seq data). Primocyte cell cluster bounded in blue dashed line. B: Violin plots showing the expression for beat-IIb, Z600 and Fas1 genes in Drosophila blood scRNA-seq data. C: Feature plot representing Ance-2 gene expression in hemocytes (scRNA-seq data). Thanacyte cell cluster bounded in blue dashed line. D: Violin plots for Ance-2, CG15506 and CG1648 expression in Drosophila blood scRNA-seq data. X-axis: PM, plasmatocytes; CC, crystal cells; LM, lamellocytes; TH, thanacytes; PR, primocytes. Y-axis: log scale normalized read count. E and F: GO pathway analysis of differentially expressed genes for primocyte (E) and thanacyte (F) cell clusters. Differentially expressed genes are shown in black, and enriched GO pathways are shown in green.
