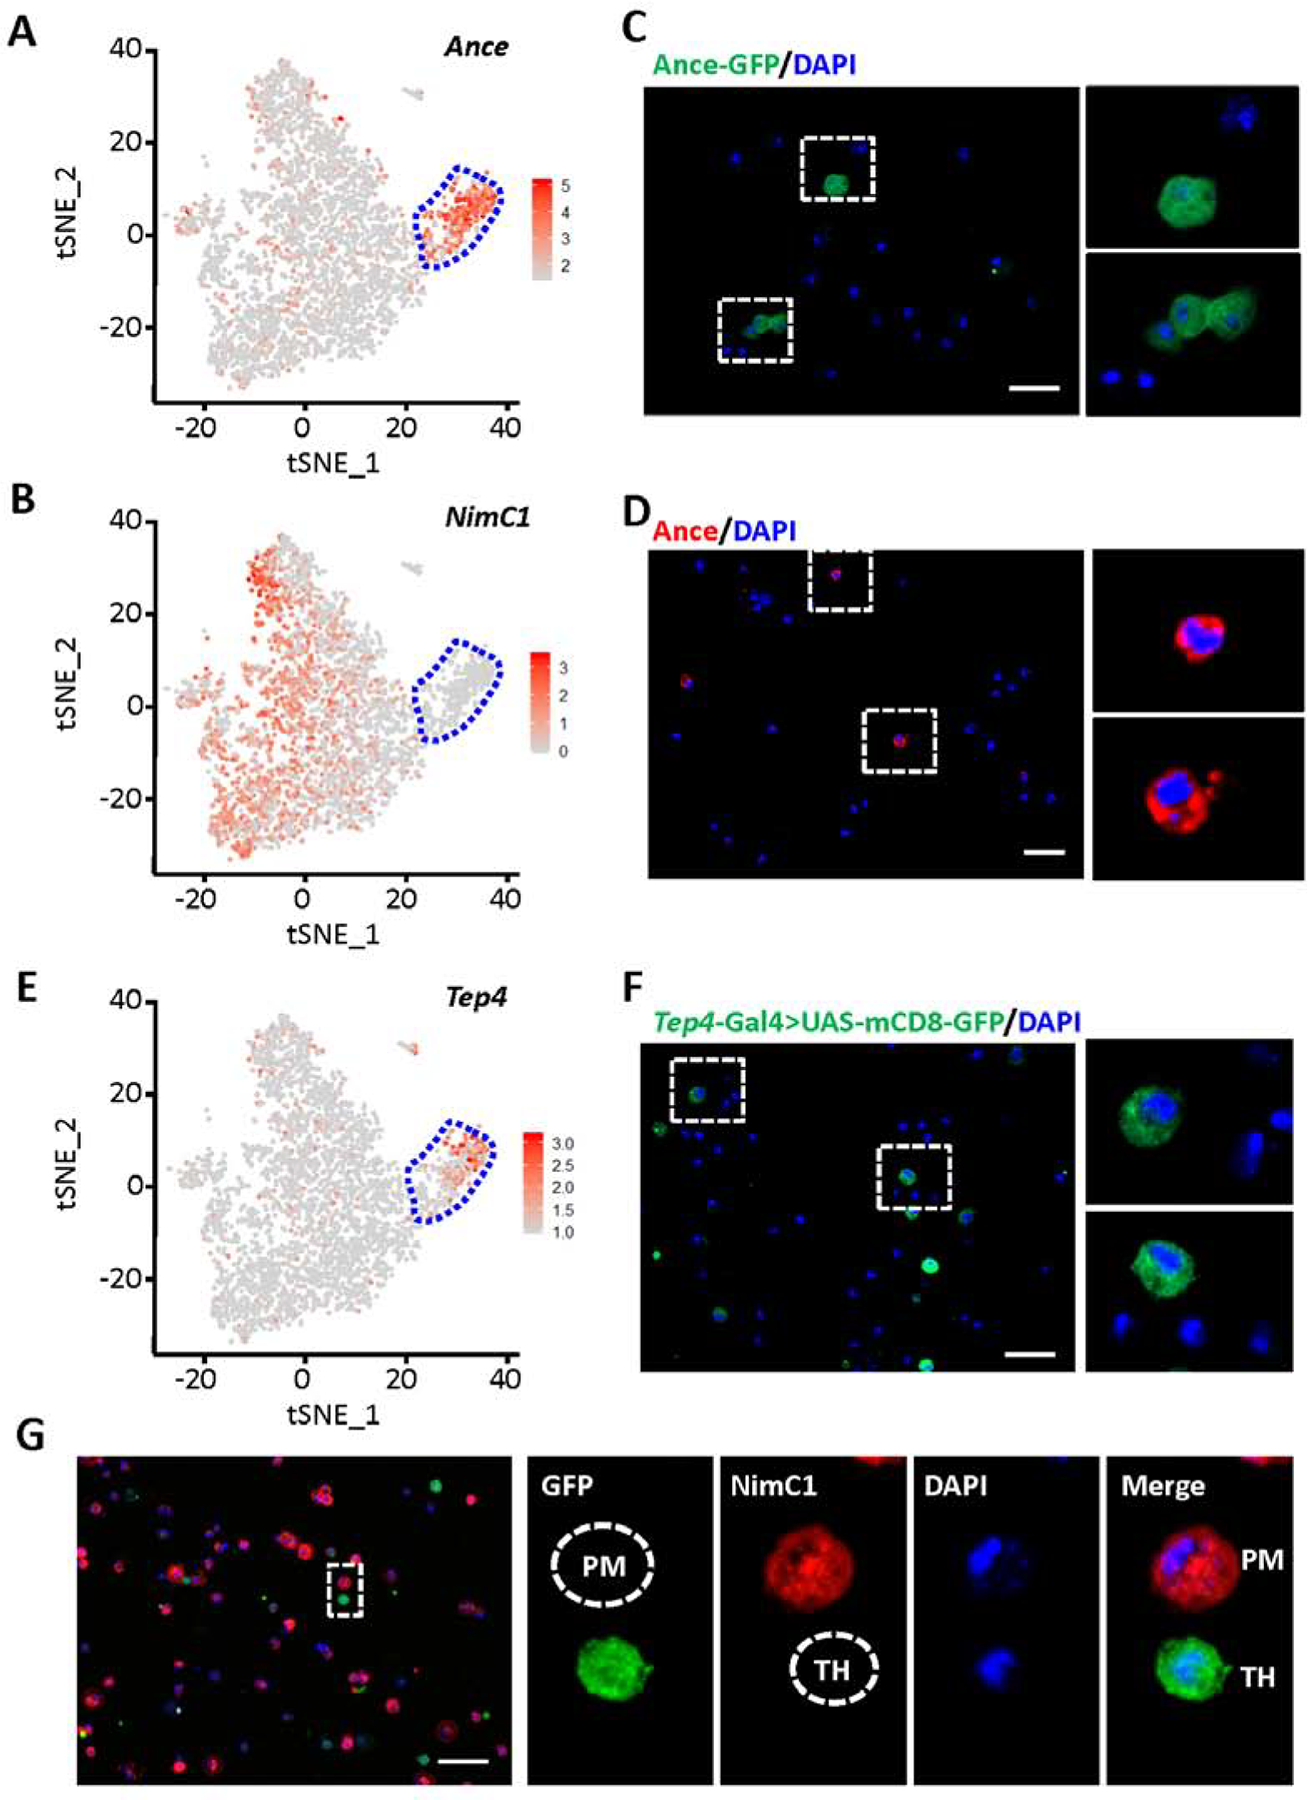
Fig. 5.

Labeling of thanacytes in Drosophila blood. A, B and E: tSNE feature plots of Drosophila blood scRNA-seq data. Thanacyte cell cluster bounded by blue dashed line. A: tSNE plot representing expression of Ance. B: tSNE plot representing expression of NimC1. E: tSNE plot representing expression of Tep4. C, D, F and G: Fluorescent images captured by Apotome microscopy. Scale bars: 20 μm. C: Ance protein expression (GFP; green) in Drosophila blood cells from Ance-GFP fly line. D: Ance protein expression (red) detected by antibody in Drosophila blood cells. F: Expression of Tep4 (green) in blood cells from a Drosophila Tep4-Gal4-driven UAS-mCD8-GFP line. G: NimC1 (P1), plasmatocyte marker, protein expression (red), and expression of Tep4 (green) in blood cells from Tep4-Gal4>UAS-mCD8-GFP Drosophila line. PM, indicates a GFP negative, NimC1 positive plasmatocyte; and, TH, indicates a GFP positive, NimC1 negative thanacyte.
