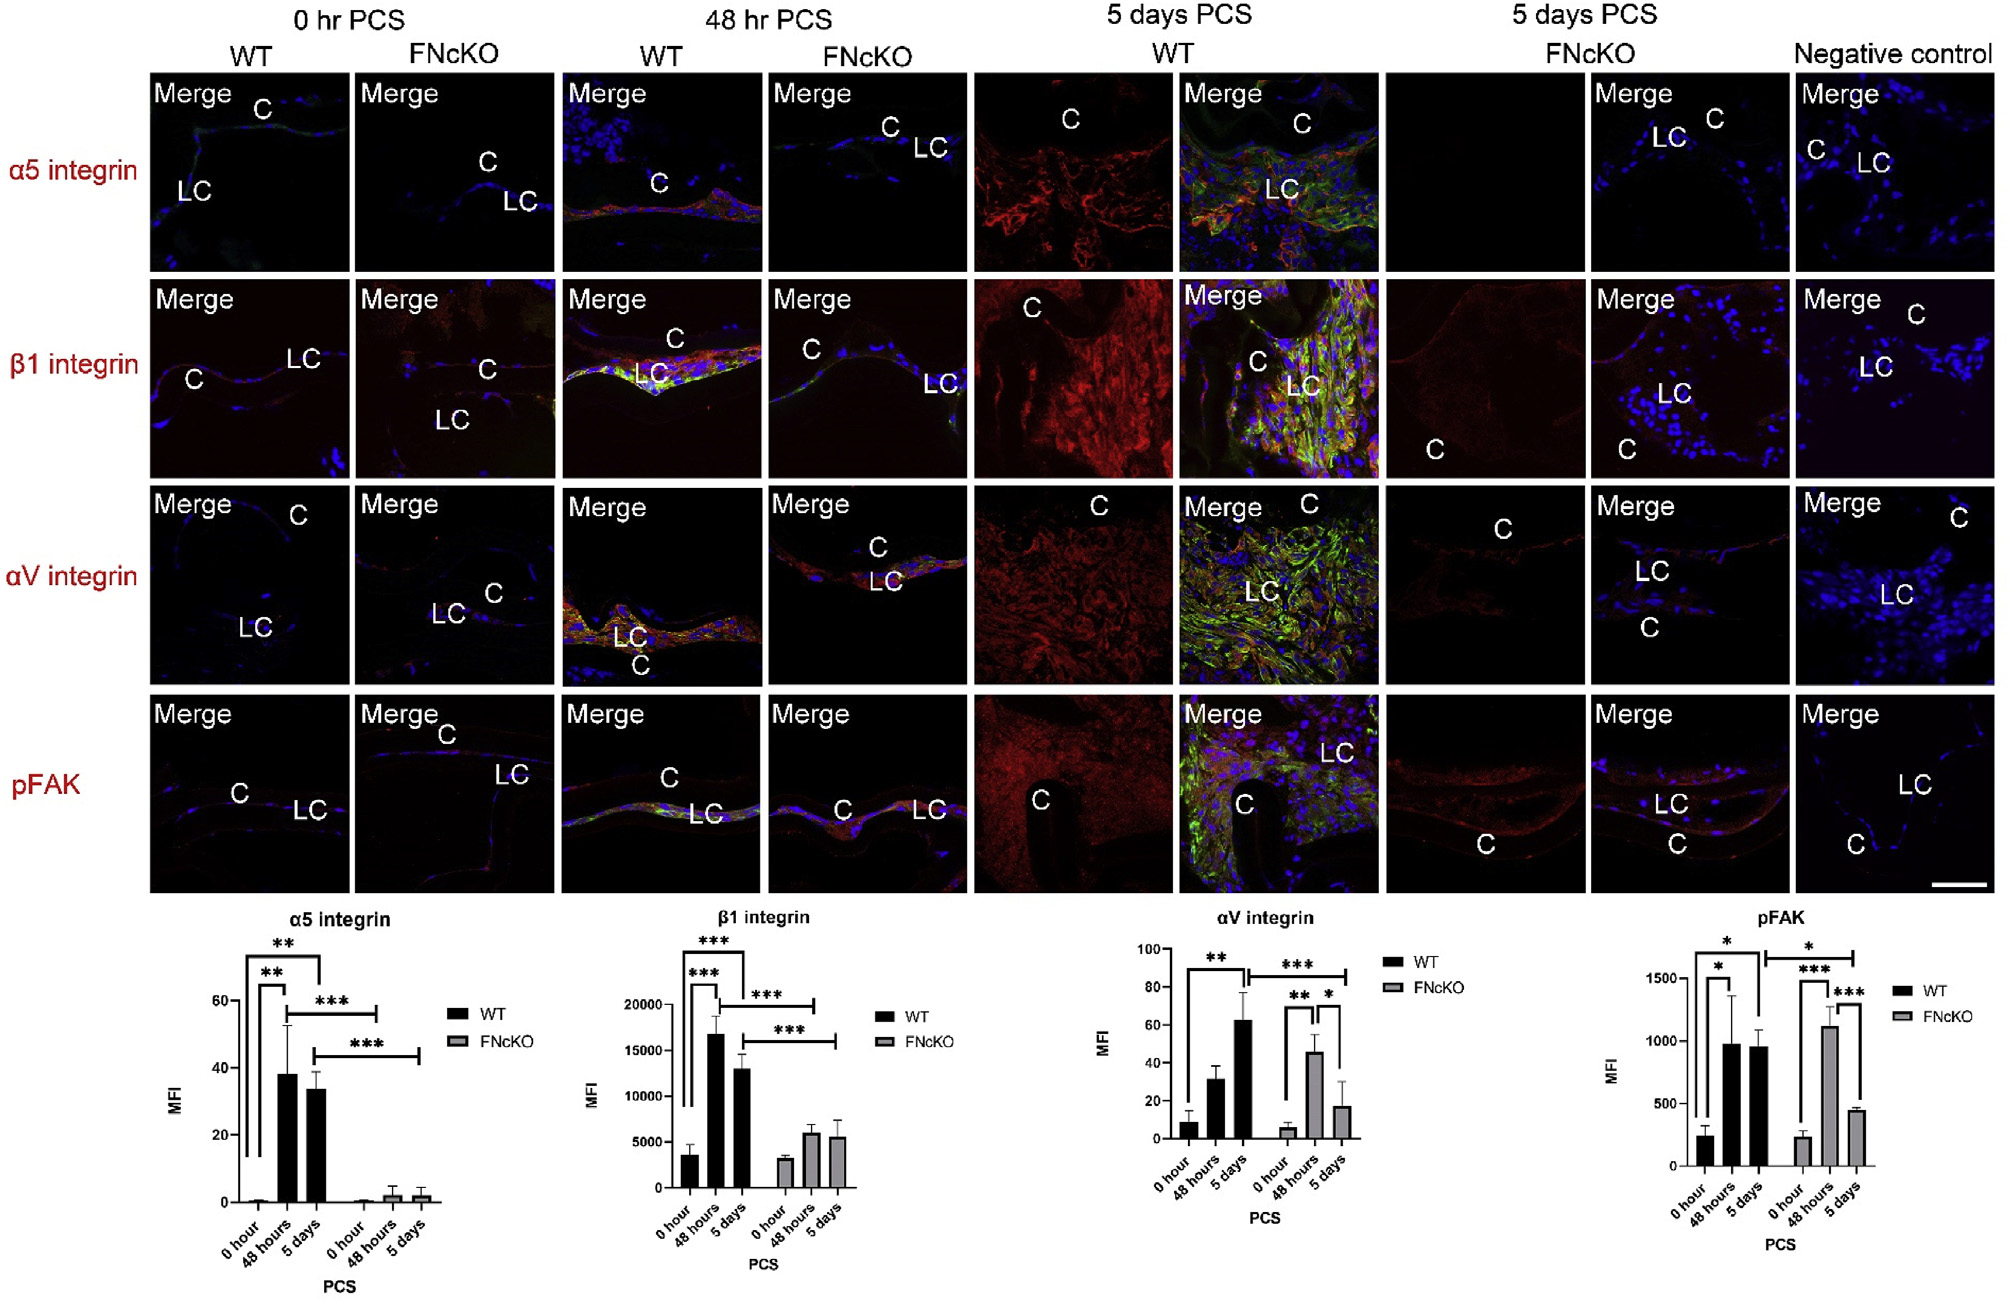
Fig. 4. Fibronectin expression by LCs is necessary for the upregulation of some integrin subunits and integrin signaling PCS.

At 0 h PCS, both WT and FNcKO LCs exhibit low protein expression for all three integrins (α5-integrin, β1-integrin and αV-integrin) while pFAK levels are also low. However, by 48 h PCS, WT LCs significantly upregulate the protein levels of α5 integrin (**P = 0.005) and β1 integrin (***P ≤ 0.001) while the upregulation of αV integrin did not reach 95% confidence of upregulation. (P = 0.070). However, the expression of all three proteins becomes quite robust by 5 days PCS (α5 integrin **P = 0.008; αV integrin **P = 0.001; b1 integrin ***P ≤ 0.001). Concomitant with the detected elevation in integrin expression, pFAK levels are significantly elevated in WT LCs by 5 days PCS (*P = 0.022). However, FNcKO LCs fail to upregulate α5- and β1-integrin protein levels at both 48 h and five days PCS compared to WT leading FNcKO LCs to have significantly less integrin staining than control at 48 h(α5-integrin ***P ≤ 0.001; β1-integrin, ***P ≤ 0.001) and 5 days PCS (α5-integrin ***P ≤ 0.001; β1-integrin ***P ≤ 0.001) compared to WT. In contrast, FNcKO LCs also initially upregulate aV-integrin (**P = 0.004) and pFAK levels (**P ≤ 0.004) at 48 h PCS, at levels not significantly different from WT 48 h (αV-integrin, P = 0.168; pFAK P = 0.576). Notably, this is not sustained as αV-integrin and pFAK upregulation is attenuated at 5 days PCS (αV-integrin ***P ≤ 0.001; pFAK *P = 0.013) compared to WT. α5-integrin, β1-integrin, αV integrin, and pFAK (red) are merged with αSMA (green) and DNA detected by Draq5 (blue). Scale bars: 35 μm; LC, remnant lens epithelial cells/lens cells; C, lens capsule. All experiments had N = 3. Values are expressed as mean þ SEM. Asterisks (*) indicate statistically significant difference in MFI between WT and FNcKO at a time PCS or between two PCS time points..
