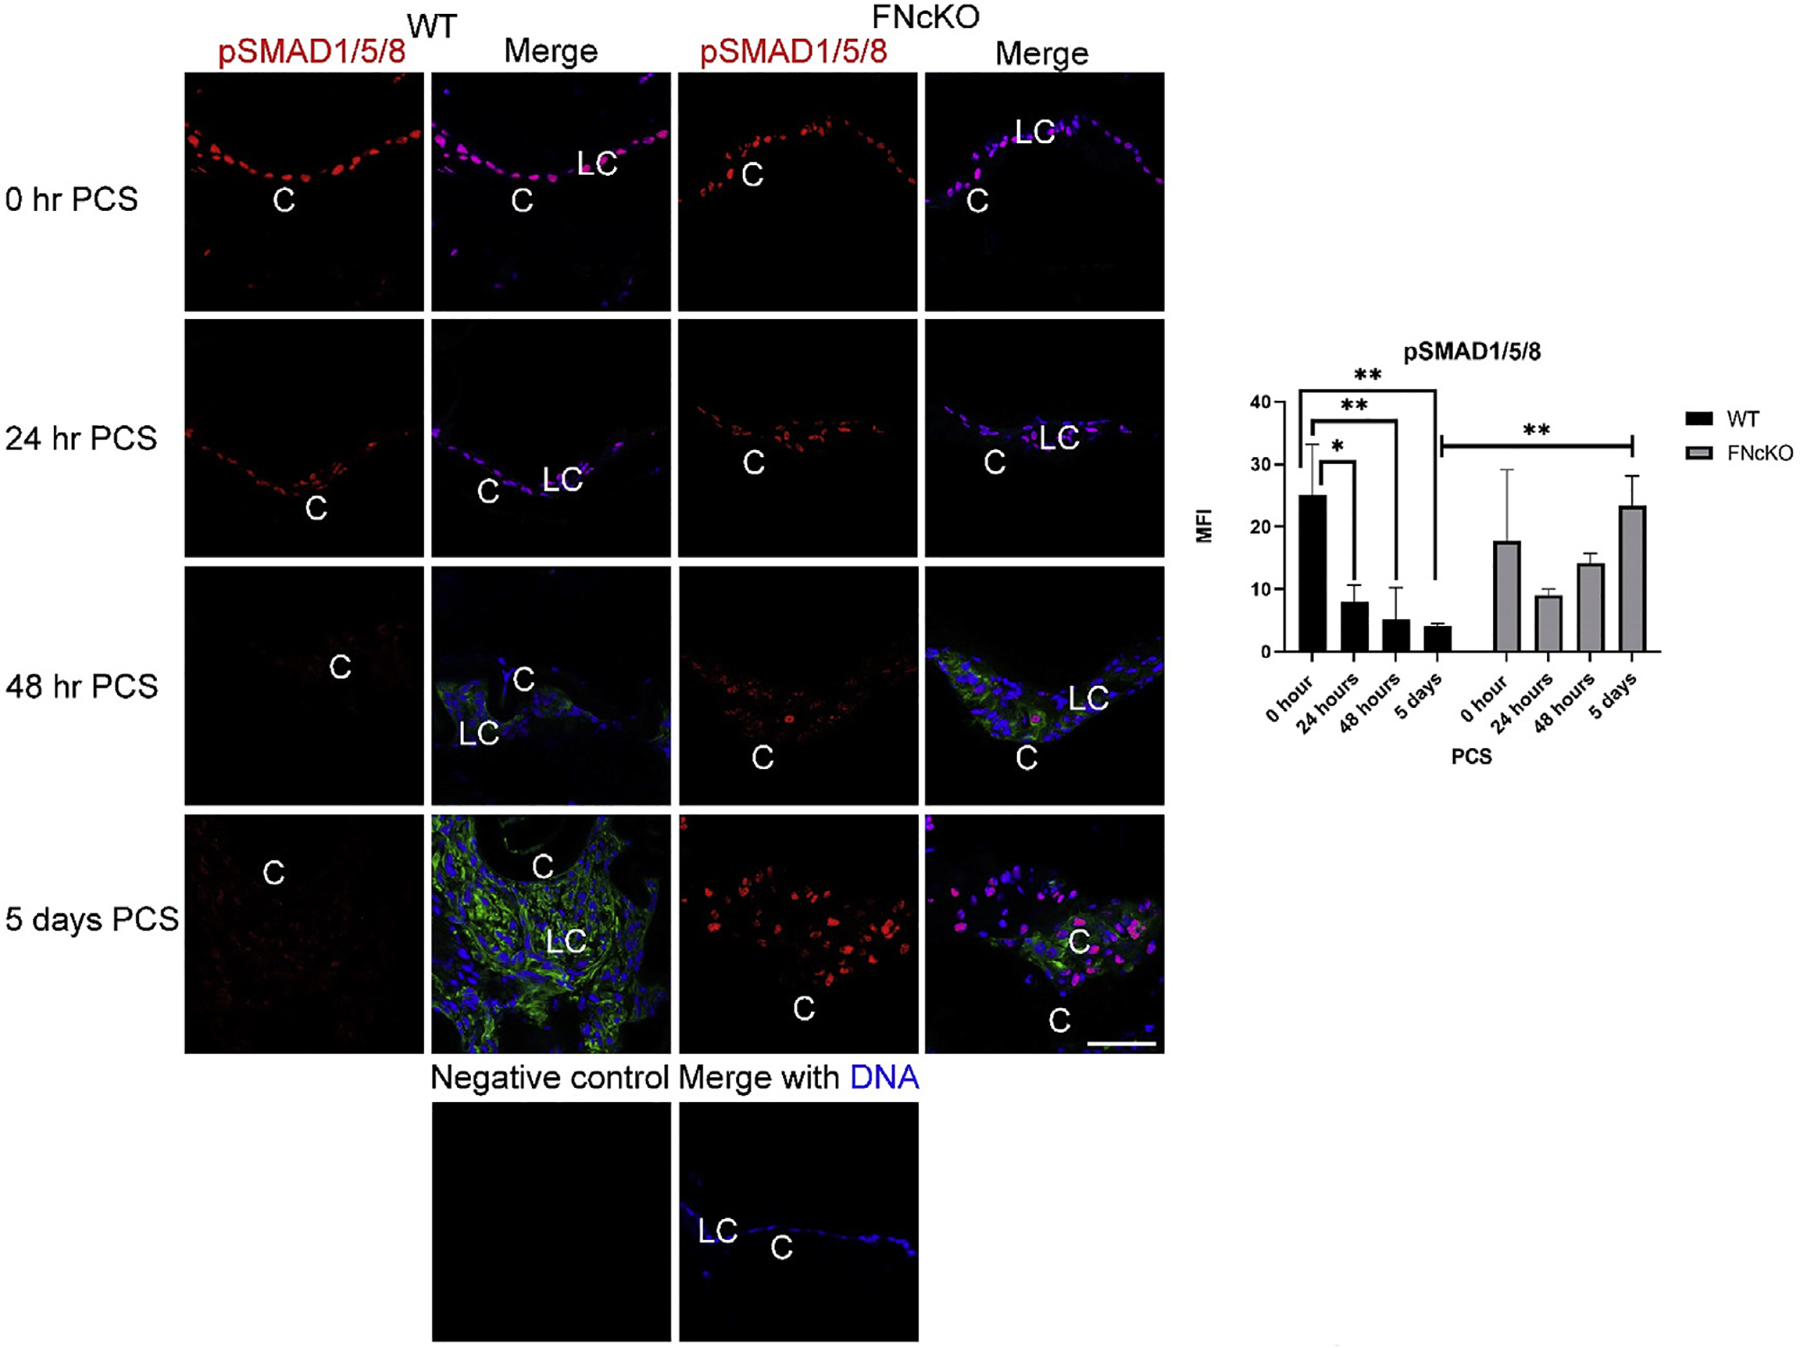
Fig. 7. The dynamics of BMP signaling in PCS LCs upon deletion of the fibronectin gene.

Immediately following lens fiber cell removal, both WT and FNcKO remnant lens cells stain robustly for pSMAD1/5/8, while this signaling begins to decrease at 24 h PCS in WT LCs (P = 0.013) although this does not occur in FNcKO LCs (P = 0.390). pSMAD1/5/8 levels continue to downregulate in WT LCs at 48 h PCS (**P = 0.006), and this reduction of pSMAD1/5/8 levels persists through 5 days PCS in WT LCs expressing αSMA (**P = 0.004). In contrast, pSMAD1/5/8 levels never significantly downregulate in FNcKO LCs, so they have elevated levels of pSMAD1/5/8 at 5 days PCS (**P = 0.003) compared to WT LCs and do not express elevated levels of αSMA. pSMAD1/5/8 (downstream of BMP signaling)=(red), αSMA (green), and DNA detected by Draq5 (blue). Scale bars: 35 μm. LC, remnant lens epithelial cells/lens cells; C, lens capsule. All experiments had N = 3. Values are expressed as mean ± SEM. Asterisks (*) indicate statistically significant change in MFI between WT and FNcKO at a PCS or between two PCS time points.
