Fig. 1.
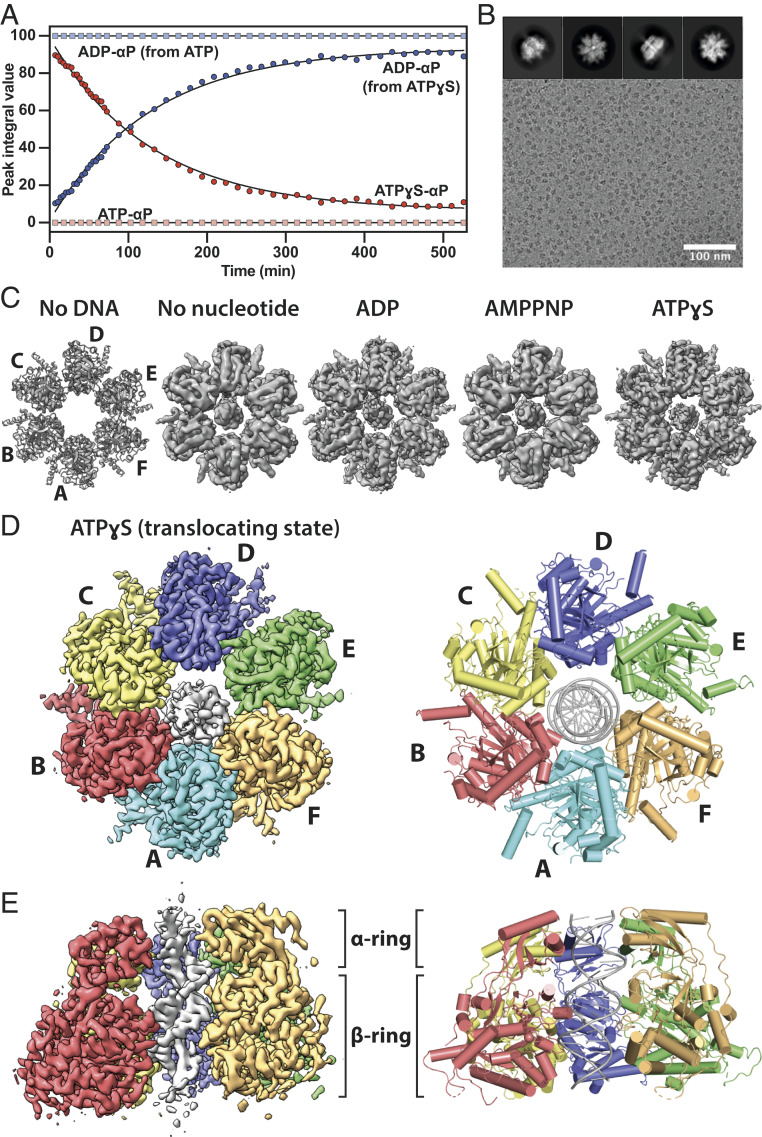
Cryo-EM structures of the FtsKαβ-DNA complex. (A) ATP and ATPγS hydrolysis by FtsKαβ over time. The data points for the α-phosphates of ATP (light red), ATPγS (dark red), and ADP (light and dark blue) were determined from their peak integrals obtained by 1D 31P NMR experiments. ATP is fully hydrolyzed into ADP before the first data point, 7 min after nucleotide addition. (B) Representative cryo-EM micrograph of FtsKαβ-dsDNA + ATPγS. Typical 2D classes (Top). (C) Top views of previous FtsKαβ crystal structure (PDB ID 2IUU) and FtsKαβ-dsDNA cryo-EM maps determined here. Only map III.E (translocating state, SI Appendix, Fig. S3) is shown for ATPγS. (D and E) A 3.6-Å resolution cryo-EM map (Left) of the FtsKαβ-dsDNA + ATPγS complex and refined atomic model (Right). Each subunit is colored differently with the double-stranded DNA in the pore. Shown as a top view, from above the α-ring through which the DNA exits the pore during translocation (D), and as a side view with subunit A removed (E).

