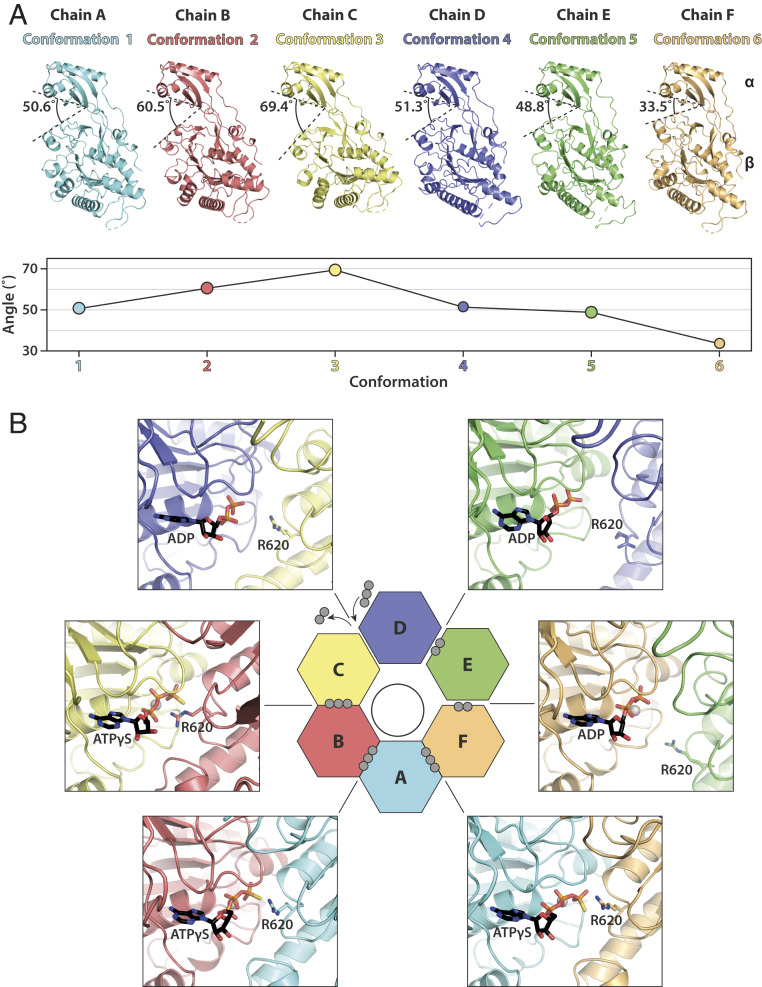
Fig. 2.
In the translocating state, FtsKαβ subunits around the ring undergo a continuous conformational transition. (A) Side-by-side comparison of FtsKαβ subunits aligned on the α-subdomains. Each subunit is in a different conformation, from here on identified by its color. The angle between α- and β-subdomains (between S383, I365, and K657 Cα) is indicated and plotted in the graph below to highlight the approximate wave nature of the intersubdomain angles. (B) Nucleotide states around the FtsKαβ ring of the ATPase sites that are located at the interfaces between two neighboring subunits. Although ADP is modeled in the C-D pocket, inspection of the EM map suggests that it is likely in exchange with ATPγS. The activity-controlling arginine finger (R620) is highlighted. Gray spheres indicate phosphates per nucleotide.

