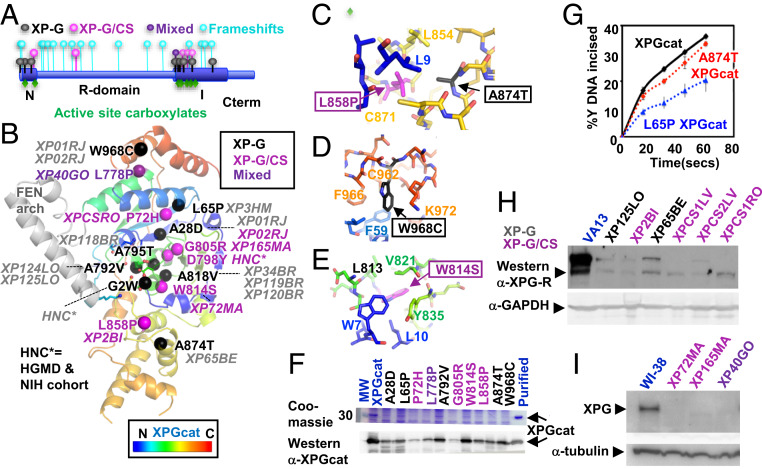
Fig. 5.
ERCC5 mutation analysis. (A) XPG schematic shows most missense XP-G and XP-G/CS pathogenic mutations map within XPGcat, with frameshifts throughout XPG. (B) Missense pathogenic mutations mapped onto XPGcat structure. Patient cell lines or source are in italics. (C) Zoom-in view of two neighboring residues that when mutated cause different diseases. XP-G mutation A874T would likely disrupt local packing of the central region, while the XP-G/CS mutation L858P would globally disrupt interaction between N- and C-terminal regions. (D) Zoom-in view showing surface exposed location of XP-G mutation W968C. Mutation is likely to disrupt local C-terminal packing. (E) Zoom-in view showing core location of XP-G/CS mutation W814S. Mutation would likely globally disrupt interaction of the N-terminal and central regions. (F) XPGcat expression level decreased with XP-G (black), XP-G/CS (plum), or mixed (purple) missense mutations relative to XPGcat (blue). Coomassie and Western analyses of crude supernatant after recombinant expression of different XPGcat mutants. Western analysis confirmed the decreased expression but showed residual levels existed. The full gel and blot are shown in SI Appendix, Fig. S6. (G) A874T and L65P XPGcat retained significant incision activity. Single turnover assays done in triplicate with 10 nM Y DNA and 25 nM protein. Error bars show SD (H and I) Western analyses of XP-G (black), XP-G/CS (plum), or mixed (purple) patient cell lines show significant reduction in XPG protein levels, compared to SV40-transformed WT control VA13 fibroblasts or hTERT-immortalized WT control WI-38 fibroblasts (blue), as appropriate. XPG detected with antibody R2; 97727 (4). The same membrane was reprobed with α-GAPDH antibody or α-tubulin for loading control. Shorter exposure of Left Upper is shown in SI Appendix, Fig. S6.

