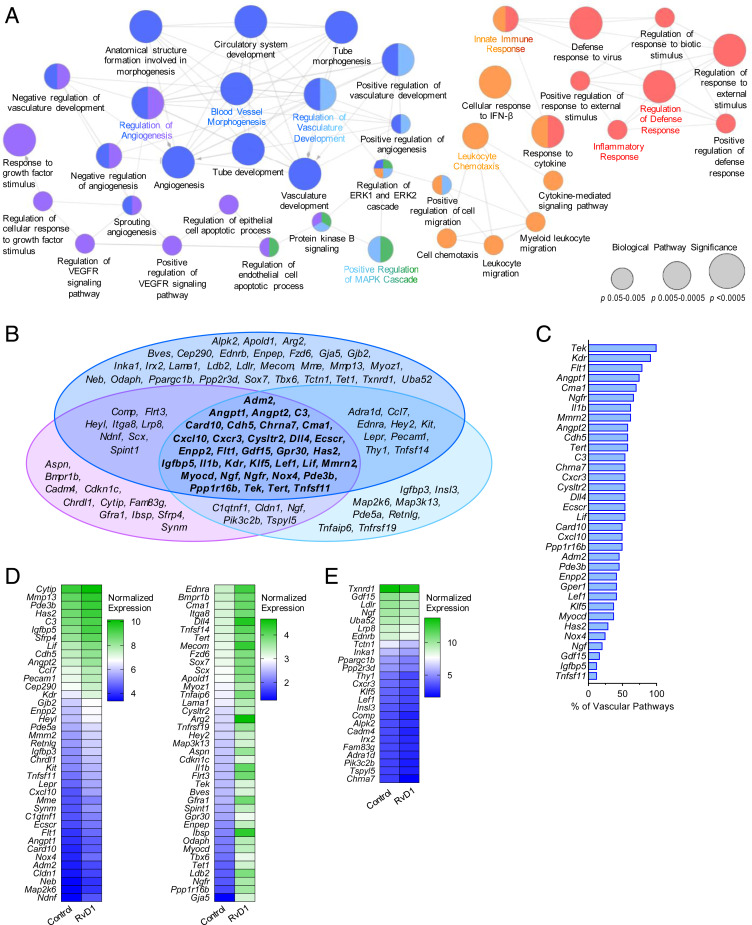
Fig. 3.
RvD1 induces a provascular transcriptomic signature in macrophages. BMDMs isolated from WT mice were exposed to RvD1 for 6 h, then subjected to RNA-seq. (A) Graphical depiction of GO enrichment analysis of differentially expressed genes and their associated biological pathways. The colors of the nodes indicate functional clusters of related biological pathways (as determined by ≥50% gene overlap between pathways), and the node size is correlated with pathway enrichment significance. (B) Venn diagram displaying the component genes of the three vascular-related functional clusters. (C) Genes common to all three vascular-related functional clusters, listed by the percentage of all vascular process-related pathways in which that gene is associated. (D and E) RvD1-induced expression changes (D, up-regulated; E, down-regulated) in all genes contained in the vascular process-related pathways shown in heatmaps listed by decreasing normalized expression. n = 3 per group.

