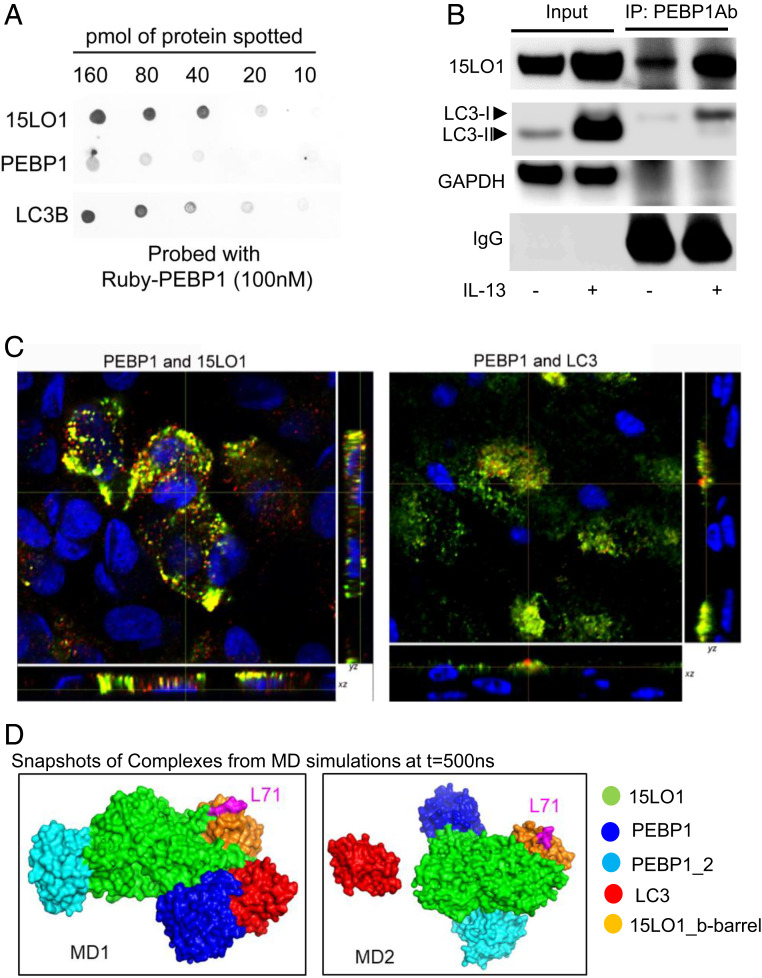
Fig. 3.
15LO1 outcompetes LC3 for binding to PEBP1 promoting its lipidation. (A) PEBP1 has greater binding affinity toward 15LO1 as compared with LC3 using dot-blot approach. The indicated quantities of purified recombinant 15LO1, PEBP1, and LC3B were applied to nitrocellulose, probed with Ruby-tagged PEBP1, and binding visualized by fluorescence at 585 nm, indicating that PEBP1 was able to bind 15LO1 and LC3B. (B) IL-13 induced more 15LO1–PEBP1 complexes as compared with PEBP1–LC3-I complexes (by Co-IP/western blot). (C) IL-13 induced more 15LO1–PEBP1 colocalization as compared with PEBP1–LC3 in HAECs by IF staining and colocalization analysis. Cells were all stimulated with IL-13 for 7 d. Green, PEBP1; red, LC3 or 15LO1; yellow, colocalization. (D) Intermolecular interactions observed in coarse-grained simulations. PEBP1 exhibited a higher propensity to form a complex with 15LO1 than with LC3. Snapshots of the complex formed at the end (t = 500 ns) of two independent runs are displayed. The interacting proteins are colored as per the key on the right, and L71 (magenta) on b barrel of 15LO1 is indicated for orientation purposes. IP, immunoprecipitation; GAPDH, glyceraldehyde-3-phosphate dehydrogenase.

