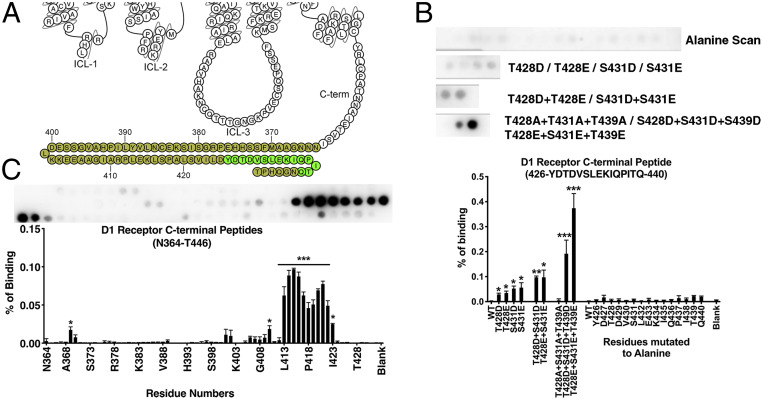
Fig. 2.
Peptide array analysis of the D1R C terminus. (A) A snake diagram (59) highlighting the residues that were tested for their role in arrestin-3 binding. (B) Peptide array analysis of the D1R426−440 peptide. As monitored by Far Western analysis (see Materials and Methods), the wild-type peptide exhibited little detectable interaction with arrestin-3; alanine scanning did not significantly affect arrestin-3 binding. Phosphomimetic substitution at positions T228, S431, and T439 enhanced binding; the effect of these mutations was additive. (C) A scan of 15-mer peptides derived from the C terminus. The residue in the Lower graph indicate the N-terminal residue of each peptide (i.e., “N364” corresponds to the D1R364−378 peptide, with the sequence NNNGAAMFSSHHEPRG). Means ± SD of at least three independent experiments are shown. Representative peptide array results are shown above graphs displaying averages. Statistical analysis was performed using one-way ANOVA followed by Tukey’s post hoc test. The statistical significance of the difference of the signal from the WT peptide spot is shown, as follows: *P < 0.05; **P < 0.01; ***P < 0.001.

