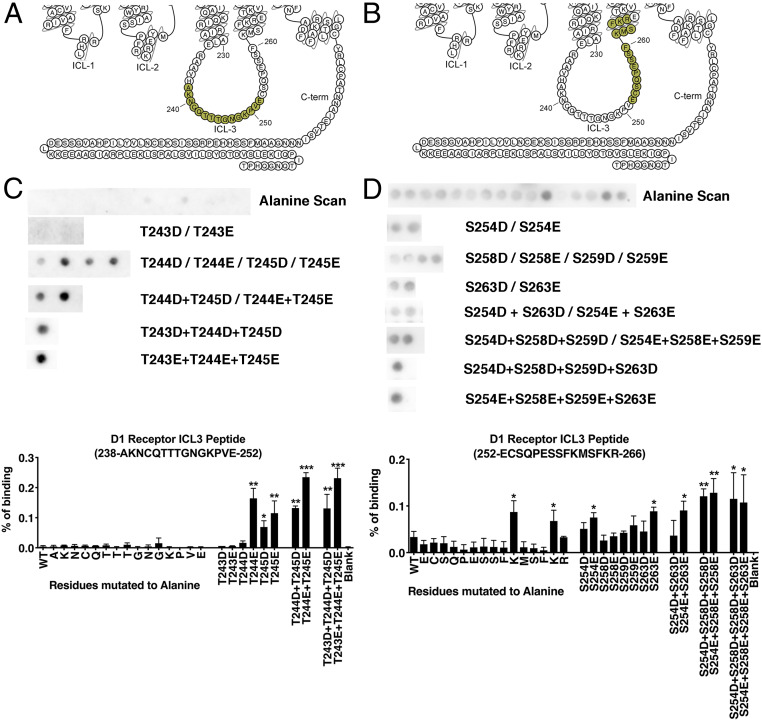
Fig. 3.
Peptide array analysis of the D1R ICL3. Peptide array analysis was used to identify residues in the D1R ICL3 that interact with arrestin-3. (A and B) Snake diagrams showing the residues in tested ICL3-derived peptides (59). Representative Far Western analysis and quantitation of the D1R238−252 peptide (C) and D1R252−266 peptide (D) following alanine scanning and phosphomimetic substitutions. Means ± SD of three to five independent experiments are shown. Statistical analysis was performed using one-way ANOVA followed by Tukey’s post hoc test. The statistical significance of the difference of the signal from the WT peptide spot is *P < 0.05; **P < 0.01; ***P < 0.001.

