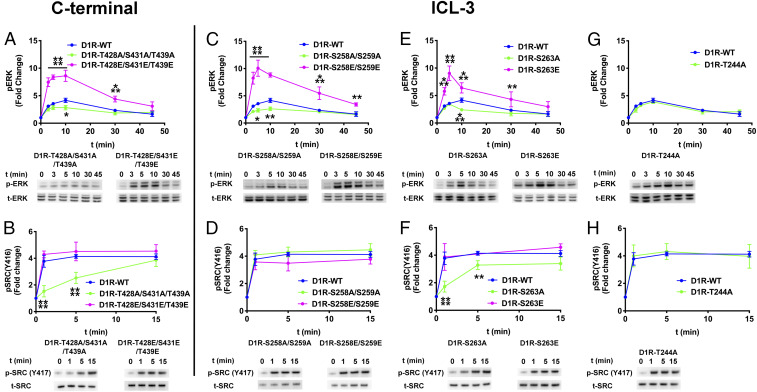
Fig. 5.
The effect of the D1R-ICL3 phosphorylation pattern on ERK1/2 and Src phosphorylation. Arrestin-2/3 KO HEK293 cells were cotransfected with plasmids encoding arrestin-3HA and wild-type or mutant D1R. The assay was initiated by adding 10 µM dopamine at 37 °C. Cell lysates were separated on a 4 to 12% gradient sodium dodecyl sulfate polyacrylamide gel electrophoresis, transferred to polyvinylidene fluoride (PVDF) membranes and immunoblotted for phosphorylated ERK1/2 (pERK), phosphorylated Src (pSrc), total ERK1/2 (tERK), and total Src (tSRC). Signals were quantified by densitometry and expressed as the fold change relative to unstimulated cells. (A, C, E, and G) Time course of ERK1/2 phosphorylation upon dopamine stimulation. (B, D, F, and H) Time course of Src activation upon dopamine stimulation. Means ± SD of at least three independent experiments are shown. D1R, arrestin-3, and GAPDH expression levels are shown in SI Appendix, Fig. S7. GAPDH expression was used as a loading control. Statistical analysis was performed with one-way ANOVA followed by Tukey’s post hoc test with correction for multiple comparisons between wild-type and mutant D1R-mediated signal at each time point. Significance is shown, as follows: *P < 0.05; **P < 0.01; ***P < 0.001; ****P < 0.0001.

