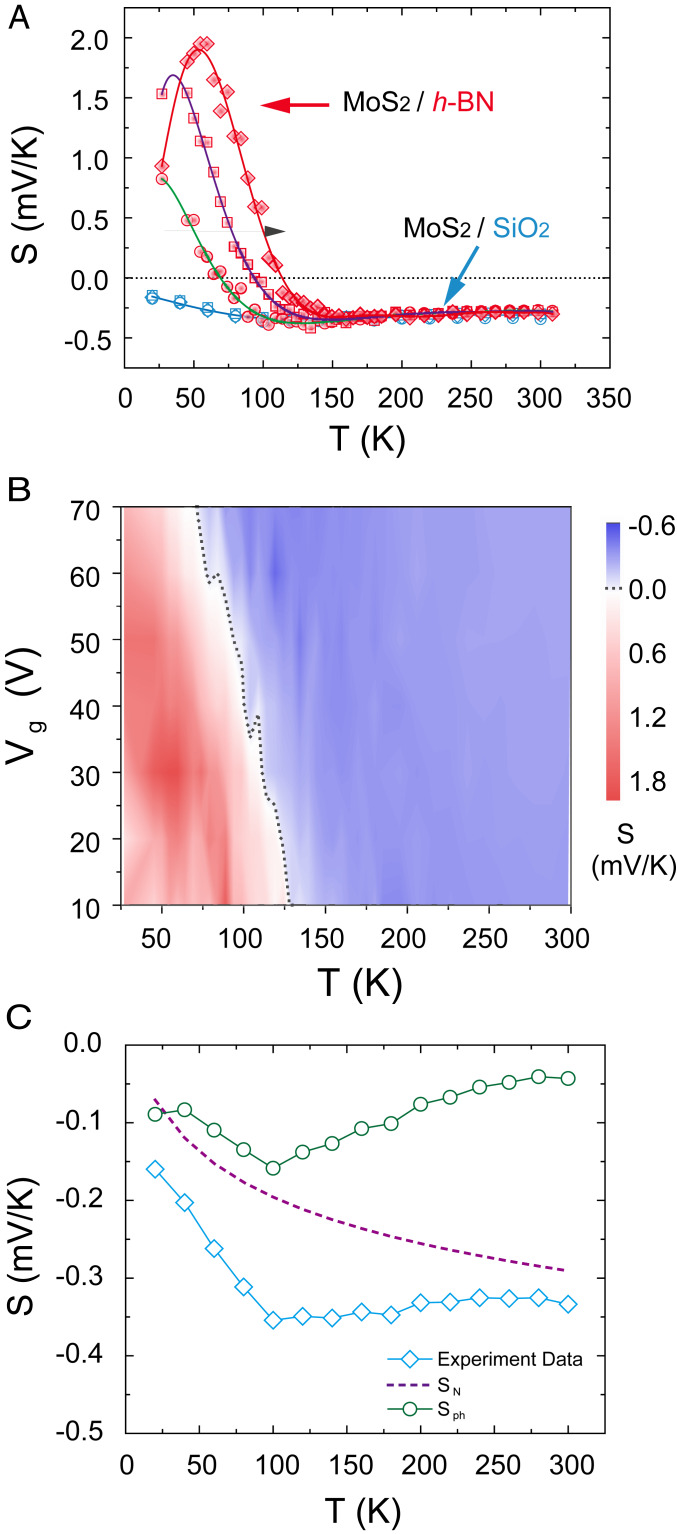
Fig. 4.
Thermoelectric transport and Seebeck coefficient measurement of defective MoS2 on h-BN substrate. (A) Comparison of S vs. T of MoS2/SiO2 and MoS2/h-BN device at Vg = 70 V (circle), 50 V(square), and 30 V (diamond) (from left to right; black arrow). The solid lines guide the eye. MoS2/SiO2 sample shows negative values due to the diffusive type n-type charge carriers. For MoS2/h-BN sample, at low temperatures, an anomalous sign change in S occurs where the majority carriers are electrons. (B) Color contour plot of S values versus Vg and T for MoS2/h-BN device. The black dotted line indicates the point with S ∼ 0 mV/K. (C) Total S values of MoS2/SiO2 sample at n = 2 × 1012 cm−2 and its respective contributions from the energy-dependent diffusion and phonon-drag Sph.

