Fig. 3.
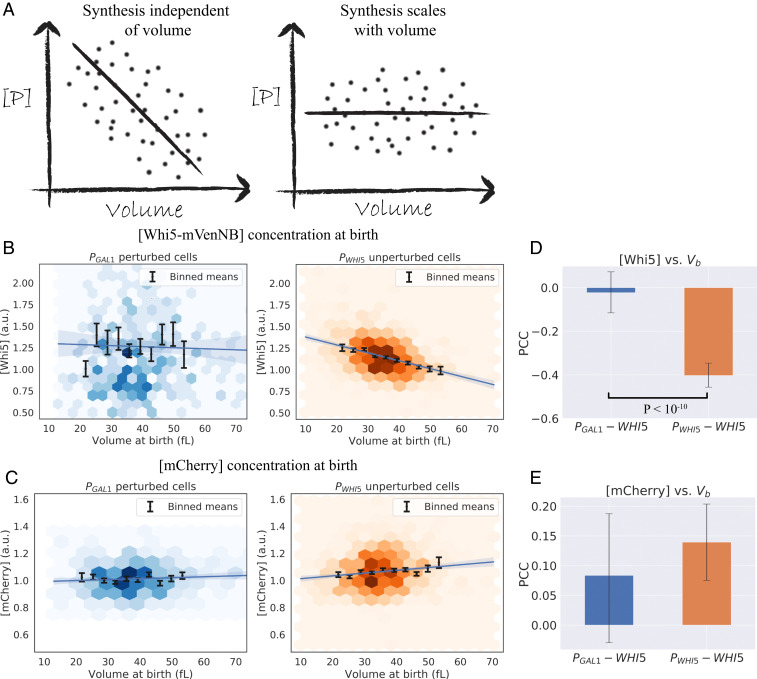
Expressing Whi5 from the GAL1 promoter alters the relationship between Whi5 concentration and cell size. (A) Illustrations of the predicted correlation of protein concentration with cell size for a gene the production rate of which scales linearly with cell volume (53), contrasted with a gene the synthesis of which does not scale with cell volume. (B and C) Concentration of fluorescent proteins at cell birth vs. volume at birth (Vb), grouped by cell type (PWHI5-WHI5 “unperturbed” cells, and PGAL1-WHI5 “perturbed” cells) and derived from time-lapse experiments to monitor cell growth. The fluorescence intensity averaged over the cell is used as a proxy for protein concentration. Colored hexagons represent a 2D histogram of data points, with darker hexagons showing increased local density of data points. Black lines correspond to averages of the same data binned with respect to Vb, with error bars showing the SEM. Blue lines correspond to linear regression fits with 95% confidence intervals. Data are compiled from three experiments for each cell type with a total of 347 PGAL1-WHI5 daughters, 800 PGAL1-WHI5 mothers, 853 PWHI5-WHI5 daughters and 1,581 PWHI5-WHI5 mothers. (B) Whi5 signal. PWHI5-WHI5 cells (orange) show a negative correlation between Whi5 concentration at birth and cell volume at birth. PGAL1-WHI5 cells (blue) lose this negative correlation, consistent with Whi5 synthesis being proportional to cell volume. (C) pACT1-mCherry signal. Daughter cells display a weak positive correlation between [mCherry] and cell volume at birth. The origin of this correlation is unknown, although it is consistent between PGAL1-WHI5 and PWHI5-WHI5 cell types. (D and E) Pearson correlation coefficients (PCC) measured for the datasets plotted in B and C. Error bars correspond to 95% confidence intervals inferred by bootstrapping analysis. Black lines correspond to statistically significant differences with P values less than 0.05 quoted, calculated using a Fisher’s z-transformation on both datasets. (D) PCC values for [Whi5] measured at birth vs. Vb for daughter cells show a statistically significant difference between cell types with P < 10−10. (E) PCC values for [mCherry] measured at birth vs. Vb for daughter cells shows no statistically significant difference between the two cell types.

