Fig. 3.
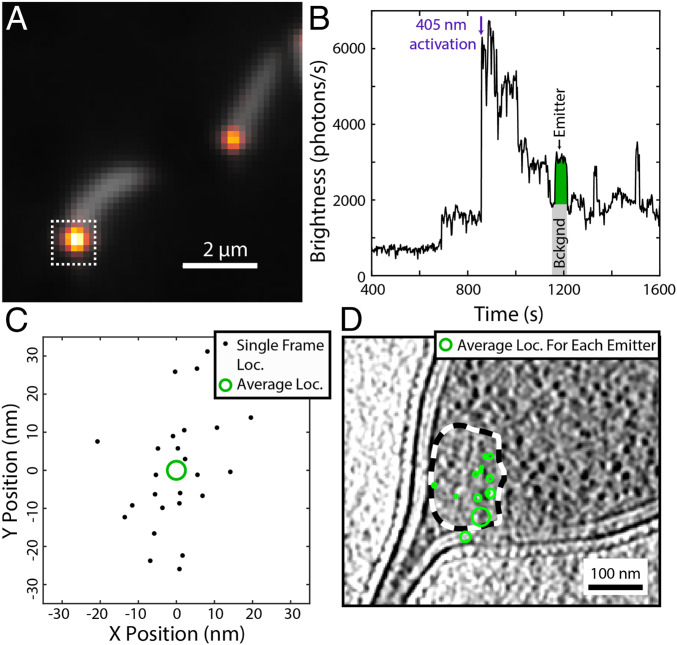
Representative cryogenic SMACM data from PAmKate–PopZ fusion constructs in C. crescentus. (A) Overlay of diffraction-limited fluorescence from the average of the 405-nm photoactivation frames (gray) showing cellular autofluorescence and the average of the 561-nm excitation frames (heat map) showing the overlapping diffraction-limited locations of PAmKate–PopZ molecules. (B) Fluorescence intensity trace from the integrated region indicated by the white dashed box in A. The fluorescence contributions from one emitter (green area) are obtained by subtracting a background (gray area) estimated by taking the average of several frames prior to the activation of the emitter. (C) Localizations from the single emitter shown in B across multiple frames (black dots). Each frame provides a noisy estimate for the true emitter’s position. These frame localizations are merged into a single estimate of the emitter’s location (green circle) with a precision given by the SE on the mean of the frame localizations represented as the radius of the green circle. (D) Overlay of the PAmKate–PopZ merged localizations (green) on a tomographic slice from their corresponding cell with the ribosome excluded region outlined with a dashed black and white line. Each green circle identifies the position and uncertainty in position of a different PAmKate–PopZ emitter.

