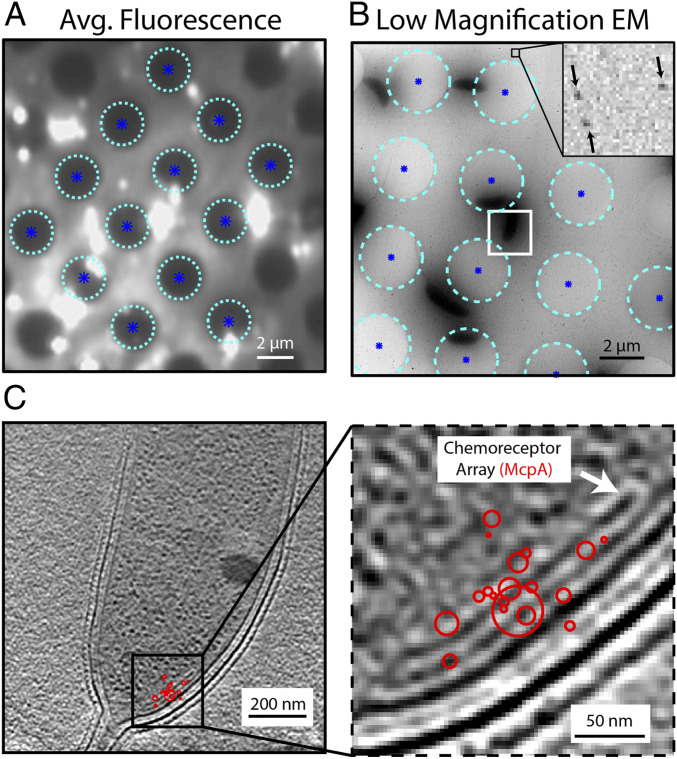
Fig. 4.
Registration of SMACM localizations and CET data. (A) Heavily saturated average fluorescence data showing the identified centers (dark blue asterisks) of the holes (cyan circles) in the holey carbon grid. These hole centers will be used as control points for a projective transformation to register fluorescence and electron microscopy images. (B) Low-magnification electron micrograph of the same region imaged in A with the same holes and hole centers identified. The Inset shows 15-nm gold beads labeled with black arrows. Gold beads neighboring the cell of interest outlined in white are used as control points for a similar coordinate transformation that will register this low-magnification micrograph with the high magnification CET data. (C) Resulting CET and McpA–PAmKate SMACM localizations (red) for the cell of interest outlined in white in B. The agreement between the position of the chemoreceptor array and the single-molecule localizations validates the image registration process.

