Fig. 6.
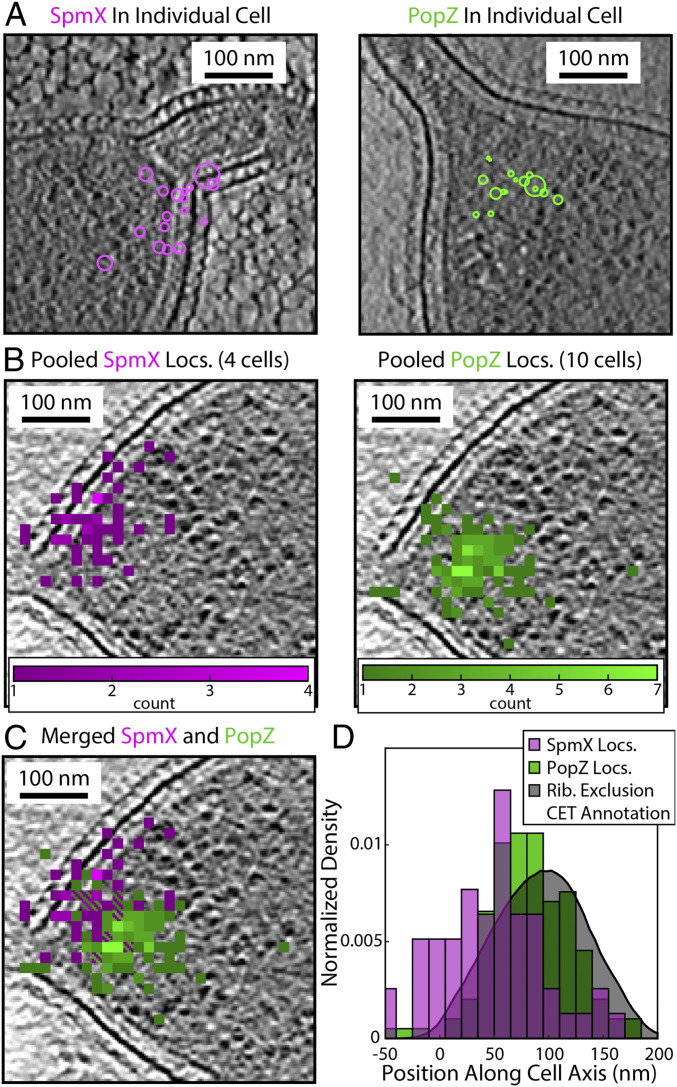
Subcellular organization of SpmX and PopZ revealed by CIASM. (A) SMACM localizations of SpmX–PAmKate (magenta) and PAmKate–PopZ (green) from individual cells registered with a tomographic slice from CET data. (B) The pooled SMACM localizations from several cells for either the SpmX–PAmKate or PAmKate–PopZ strains. Cells were aligned and the localizations pooled based on their correlative CET data and overlaid onto a representative tomographic slice. For representation, localizations were binned to produce a histogram with 14.5-nm pixels. (C) Merged data from B showing the relative positions of SpmX and PopZ. (D) Distributions of SpmX and PopZ localizations along the cell axis, where zero is defined as the base of the stalk as identified in CET. The shaded gray curve is the result of manual annotation of the ribosome exclusion region from the CET data, which shows good agreement with the PAmKate–PopZ localizations.

