Fig. 2.
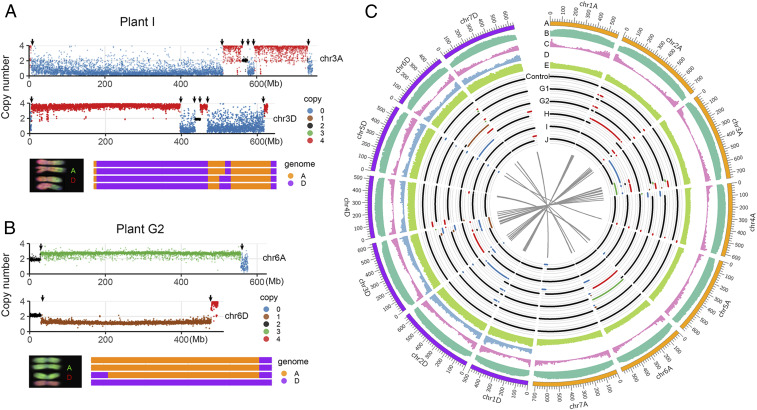
Illustration of HE events based on whole-genome resequencing data. (A and B) Two examples of HE junctions in A and D chromosomes. The first and second tracks represent the profile of genomic copy number in A and D chromosomes, respectively. Blue, brown, black, green, and red dots represent genomic copy number from 0 to 4, respectively. Arrows indicate the position of HE junctions. The third track is a schematic summary of the chromosome constitution with corresponding karyotype diagram. (C) Summary of HE events and related genomic features. The feature density for each track was calculated based on a 10-Mb interval. Track A, the 14 chromosomes (orange and purple indicate chromosomes derived from the A and D subgenome, respectively); track B, TE density; track C, gene density; track D, density of SNP between A and D subgenomes; track E, CCN repeat motif; track Control, genomic copy number of control sample (the other five euploid tetraploids shared an identical HE event with the control sample, including a homoeolog translocation between chromosomes 4A and 5D; see main text for explanation); track G1-J, genomic copy number of five compensated euploidy plants. Blue, brown, black, green, and red lines represent genomic copy number from 0 to 4, respectively. The gray linkers in inner track indicate homoeologous HE junction pairs.

