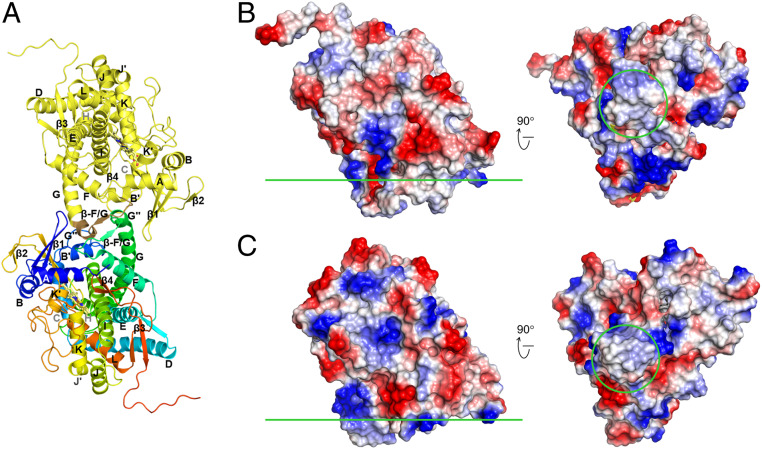
Fig. 4.
Membrane-binding regions. (A) The substrate-free dimeric CYP97A3 structure. Chain A is colored in yellow, and the F/G loop is colored in brown; chain B is colored in rainbow with the N terminus in blue and C terminus in red. (B) Electrostatic potential surface of the substrate-free CYP97A3 structure (chain A). The membrane interface is indicated by the green line (Left, side view; Right, bottom view). The F/G loop region is circled. (C) Electrostatic potential surface of the OTG-bound CYP97C1 structure.

