Fig. 2.
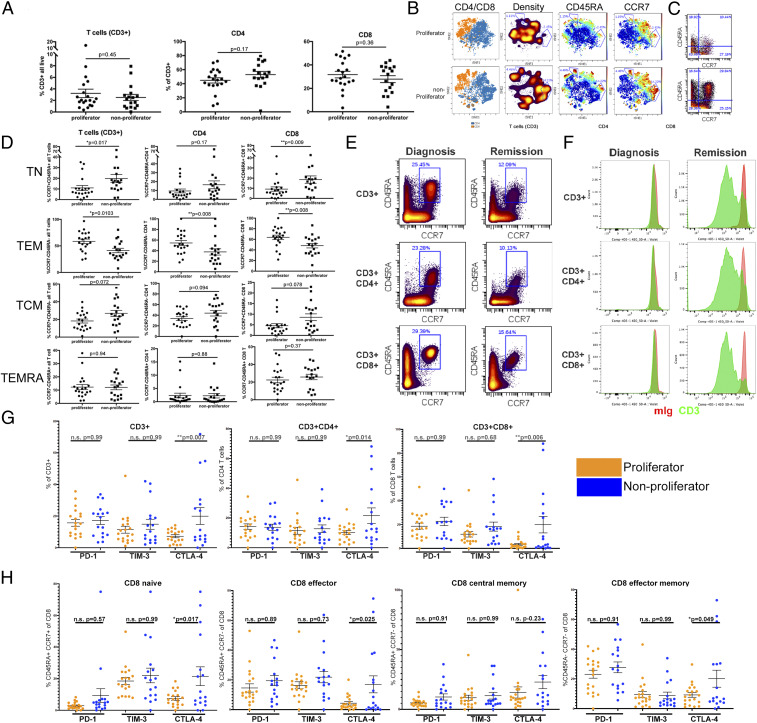
Impaired T cell proliferation is associated with an increase in naïve CCR7+ CD45RA+ T cell phenotype. (A) Frequency of T cells of all live cells (Left) and frequency of CD4+ (Center) or CD8+ (Right) of T cells. (B) Concatenated files representing all samples in the proliferator group (Upper) or nonproliferator group (Lower) projected in tSNE after gating on CD3+ cells. Distribution of CD4+ and CD8+ T cell subsets is shown in blue and orange, respectively (first column). Density plots show regions with reduced representation in the proliferator samples (second column). Intensity of CD45RA and CCR7 are mapped to the projections (third and fourth columns). (C) Representative plots of CCR7 vs. CD45RA staining from a sample in each group. (D) Percentages of T cell subpopulations gated on all T cells (Left column), CD4+ T cells (Center column), or CD8+ T cells (Right column). Differences in phenotypic distribution of TN (CCR7+ CD45RA+, Upper), TEM (CCR7− CD45RA−, second row), TCM (CCR7+ CD45RA−, third row), and TEMRA (CCR7− CD45RA+, Lower) T cell subsets. (E) T cell phenotype in an individual patient at diagnosis and after chemotherapy-induced remission. Frequency of CCR7+ CD45RA+ for indicated T cell subsets at the time of diagnosis (Left column) and remission (Right column). (F) CTV dilution from sample in E in response to incubation with mIgG + mIgG (red histogram) or anti-CD3 + mIgG (green histogram). (G) Frequency of T cells positive for PD-1, TIM-3, and CTLA-4 as a percentage of all CD3+ (Left), and CD4+ (Center) or CD8+ (Right) T cells, comparing proliferators (orange) and nonproliferators (blue). (H) Percentage of cells positive for PD-1, TIM-3, and CTLA-4 on CD8+ TN, TEM, TCM, and TEMRA subsets as defined in D. Bars represent mean ± SEM. Statistical tests are Student’s t test for A and D, one-way ANOVA with multiple comparisons of groups shown. Bonferroni correction for multiple testing was used.

