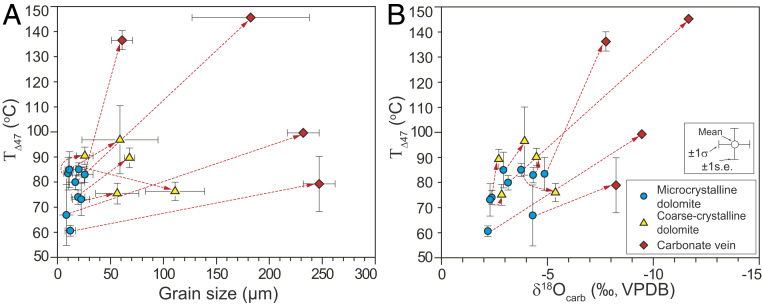
Fig. 2.
Cross-plots of TΔ47 versus grain size (A) and TΔ47 versus δ18Ocarb (B) for eight samples from study Doushantuo Formation and one sample from overlying Dengying Formation, which have different carbonate textures. The red dashed line, which points away from blue-filled circles to yellow-filled triangle or red-filled diamond, are coded to different textures in the same sample (see legend).

