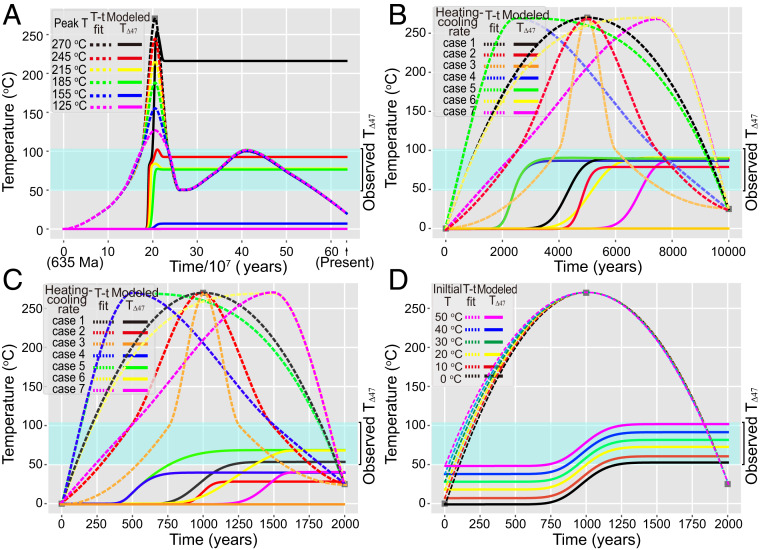
Fig. 4.
Solid-state reordering modeling of the study Doushantuo Formation. (A) Model results for long-duration (∼107 y) hydrothermal events. These models assumed an initial temperature of 0 °C and peak temperatures of 125, 155, 185, 215, 245, and 270 °C with symmetric heating–cooling rates over a 6 × 10⁷-y interval beginning at 460 Ma. The models were based on the reconstructed thermal history of Fig. 3 from 635 Ma to the present. (B and C) Model results for short-duration (B: ×104 y; C: ×103 y) hydrothermal events. These models assumed an initial temperature of 0 °C, a peak heating temperature of 270 °C for 10,000 y (in B) or 2,000 y (in C) with variable heating–cooling rates, including three symmetric heating–cooling cases (cases 1 to 3) and four asymmetric heating–cooling cases (cases 4 to 7). (D) Model results assuming a varying initial temperature from 0 to 50 °C, a peak temperature of 270 °C for 2,000 y, and a fixed heating–cooling rate (i.e., case 1 in C). In all subfigures, the “T-t fit” lines denote assumed heating T-time paths, while the “Modeled T∆47” lines denote the corresponding T∆47 evolution of the Doushantuo dolomites predicted by a solid-state reordering model. The shallow blue bands represent the range of measured T∆47 values of well-preserved Doushantuo dolomites in this study. See Results and Discussion for further details.

