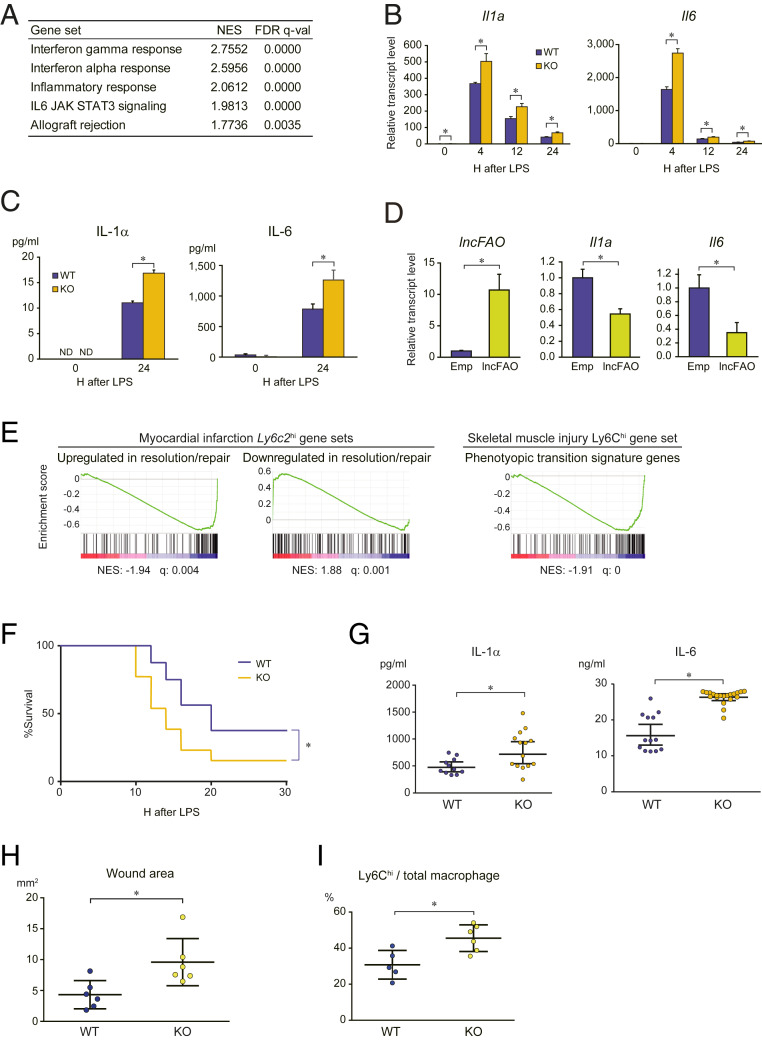
Fig. 2.
lncFAO deletion augments inflammatory responses. (A) Transcriptomes of BMDMs from WT and lncFAO−/− mice were analyzed using RNA-seq 12 h after LPS treatment. Gene set enrichment was analyzed using GSEA (28). Shown are false-discovery rate < 0.05 MSigDB hallmark gene sets up-regulated in lncFAO−/− cells as compared to WT cells. NES, normalized enrichment scores. (B) qPCR analysis of Il1a and Il6 in BMDMs from WT and lncFAO−/− mice. mRNA levels were first normalized to those of 18s rRNA and then to the level in untreated (0 h) WT BMDMs. n = 3 for each group. *P < 0.05, two-tailed unpaired Student’s t test. (C) IL-1α and IL-6 levels in medium collected from BMDM cultures 24 h after LPS treatment. n = 3. *P < 0.05, two-tailed unpaired Student’s t test. (D) BMDMs were transfected with empty vector (E) or an lncFAO expression vector; 24 h after transfection, the cells were treated with LPS, and mRNA levels were assessed after an additional 24 h. mRNA levels were first normalized to those of 18s rRNA and then to the level in WT BMDMs. n = 3. *P < 0.05, two-tailed unpaired Student’s t test. (E) Dysregulation of the signature genes representing the transition of Ly6Chi macrophages from the inflammation to resolution/repair phase after MI or skeletal muscle injury in lncFAO−/- BMDMs. Shown are GSEA enrichment scores in untreated lncFAO−/− BMDMs as compared to WT BMDMs (28). The MI gene sets consist of the genes up-regulated (107 genes) or down-regulated (144 genes) from day 3 to day 7 in Ly6c2hi macrophages in the single-cell RNA-seq dataset for MI (SI Appendix, Figs. S2 and S3) (37), and the skeletal muscle injury gene set consists of the genes enriched in Ly6Chi macrophages on day 4 in injured skeletal muscle (127 genes) (38). (F) Kaplan–Meier survival curves for WT and lncFAO−/− mice intraperitoneally injected with a high-dose of LPS (50 μg/mg). n = 10 for each group. *P < 0.05, log-rank test. (G) Mice were intraperitoneally injected with a low-dose of LPS (20 μg/mg), and blood levels of IL-1α and IL-6 were analyzed 12 h after the injection. Shown are concentrations of each mouse and the means ± SD n = 10 (WT) or 12 (KO) mice. *P < 0.05, two-tailed unpaired Student’s t test. (H) Quantification of the wound area 8 d after skin excision in mice transplanted with WT or lncFAO−/− bone marrow. *P < 0.05, two-tailed unpaired Student’s t test. (I) Flow cytometric analysis of the phenotypes of the macrophages (CD45.2+CD11b+F4/80+Ly6G−) infiltrating the wound area. The fraction of proinflammatory Ly6Chi macrophages is shown. *P < 0.05, two-tailed unpaired Student’s t test.

