Fig. 3.
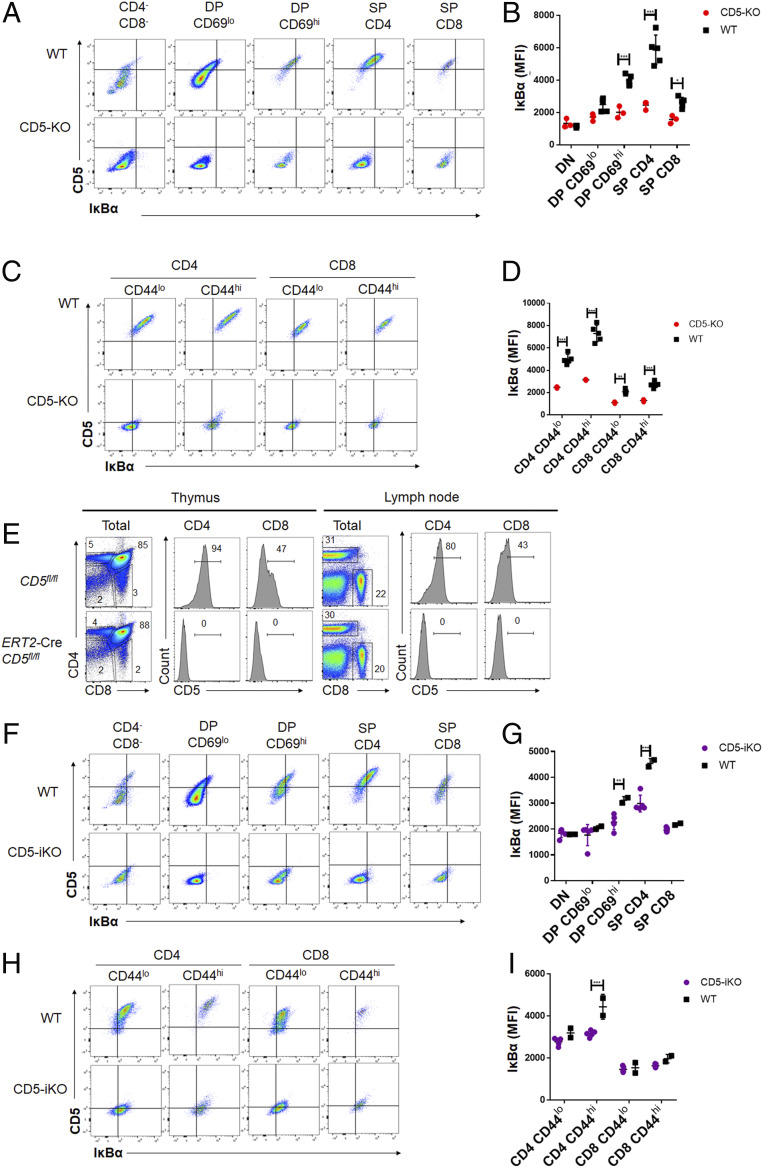
The surface expression of CD5 is necessary for maintaining heterogenous levels of IκBα in T cells. (A) A similar gating strategy as in Fig. 2A was used to examine different thymocyte subsets in WT (Upper) or CD5-KO (Lower) mice and representative flow plots are shown. (B) The gMFI of CD5 and IκBα on thymocyte populations as gated in Fig. 2A from WT or CD5-KO mice (n = 3 to 5 from 1 experiment; statistical significance was calculated using two-way ANOVA with Sidak’s multiple comparisons test). (C) Peripheral live, TCR-β+ CD4, or CD8 T cells from the pooled lymph nodes of WT or CD5-KO mice were analyzed for CD5 and IκBα expression and a representative set of flow plots are shown. (D) The gMFI of CD5 and IκBα gMFI in peripheral CD4 or CD8 T cells gated as indicated above from lymph nodes, respectively (n = 3 to 5 from 1 experiment; statistical significance was calculated using two-way ANOVA with Sidak’s multiple comparisons test). (E) Representative flow plots of thymocytes and peripheral T cells isolated from lymph nodes of CD5-floxed mice with CAG-CreERT2 transgene (CD5 inducible knockouts; CD5-iKO) after treatment with tamoxifen for 5 d. Histograms of CD5 expression are shown. (F) The expression of CD5 and IκBα in thymocytes of either wild-type (WT, Upper) or CD5-floxed mice with CAG-CreERT2 transgene (CD5-iKO, Lower) after treatment with tamoxifen for 5 d. Representative flow plots are shown. (G) CD5 and IκBα gMFI on thymocytes as gated in Fig. 2A from WT or CD5-iKO mice (n = 2 to 5 from 1 experiment; statistical significance was calculated using two-way ANOVA with Sidak’s multiple comparisons test). (H) The expression of CD5 and IκBα in peripheral T cells in either WT or CD5-iKO mice after treatment with tamoxifen for 5 d. Representative flow plots are shown. (I) CD5 and IκBα of peripheral CD4 or CD8 T cells gated as indicated above from lymph nodes of WT or CD5-iKO mice (n = 2 to 5 from 1 experiment; statistical significance was calculated using two-way ANOVA with Sidak’s multiple comparisons test).

