Fig. 1.
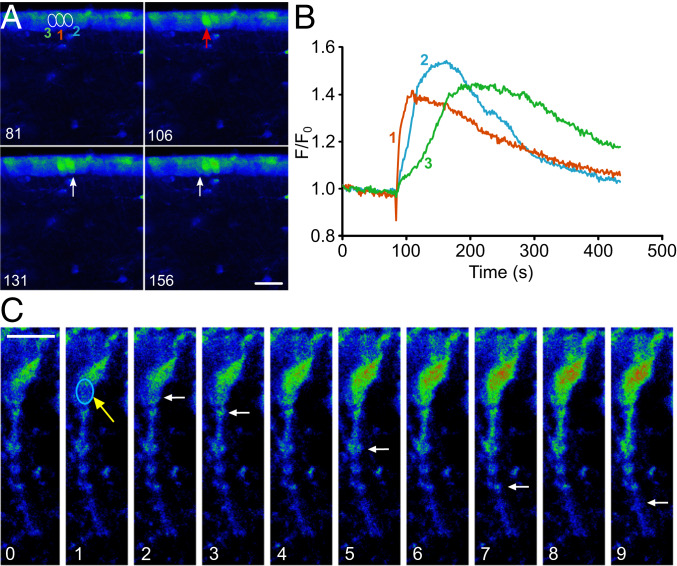
Ca2+ signaling evoked by infrared stimulation of a single tanycyte. (A) Montage showing images of the Ca2+ response (Rhod-2) to infrared stimulation of single tanycyte (ROI 1 and red arrow). The tanycytes on either side (ROIs 2 and 3 and white arrows) exhibit an increase of Ca2+ following the stimulation of tanycyte 1. The numbers in the lower left corners represent the times of the images (s) and match the graph in B. (Scale bar, 20 µm.) (B) Quantification of the change in Ca2+ illustrated in A. Note that tanycyte 3 reaches its peak response some 100 s after the initial stimulation of tanycyte 1. (C) Montage showing a single tanycyte. The soma was stimulated (blue ROI and yellow arrow) and a localized increase in Ca2+ was induced, which then traveled along the process (white arrows). Numbers in lower left corners represent the times of the images in seconds. (Scale bar, 10 µm.)

