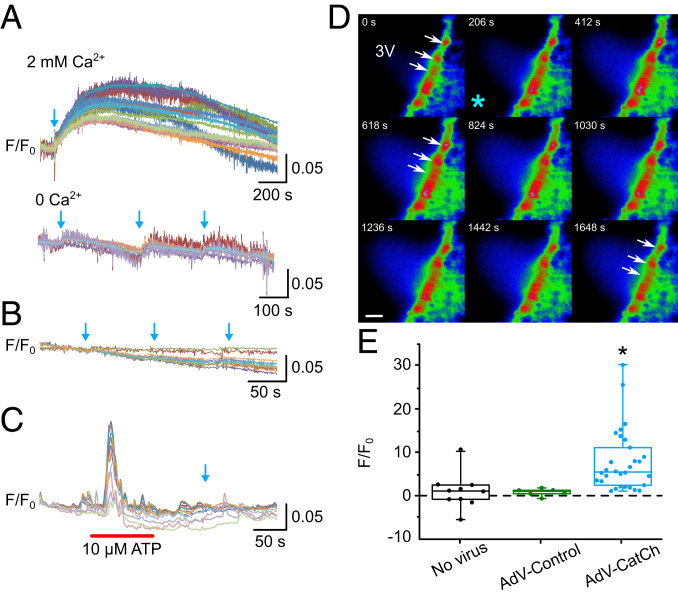
Fig. 3.
Optogenetic stimulation of tanycytes transduced with CatCh evokes long-lasting Ca2+ waves. (A) Intracellular Ca2+ (measured with Rhod-2) evoked by blue light (470-nm) optostimulation (indicated by the blue arrows). Each colored line represents an ROI, drawn around a single tanycyte cell body. In the second recording, removal of extracellular Ca2+ greatly attenuated the Ca2+ signal evoked by optostimulation. (B) In slices obtained from control animals injected with AdV-Control (pTSHR-GCaMP3, used as a control in the study), there was no effect of optostimulation on intracellular Ca2+. (C) To confirm the viability of tanycytes in the control brain slices, we used bath application of 10 μM ATP to trigger a Ca2+ response. Optostimulation did not produce any response (blue arrow). (D) Montage of pseudocolor images showing a response in tanycytes to the blue light optostimulation (delivered at the site of the asterisk). ROIs were drawn around individual tanycyte cell bodies to measure their activation. White arrows indicate tanycytes that respond to stimulation. (Scale bar, 50 μm.) Numbers in each image are the times in seconds after the beginning of recording. (E) Percent change in F/F0 evoked by optostimulation in sham controls (no virus), AdV-Control (GCaMP3 used as controls), and AdV-CatCh-transduced tanycytes. *P < 0.05. (The box represents the upper and lower quartiles, the central line the median, and the whiskers the maximum and minimum values.)

