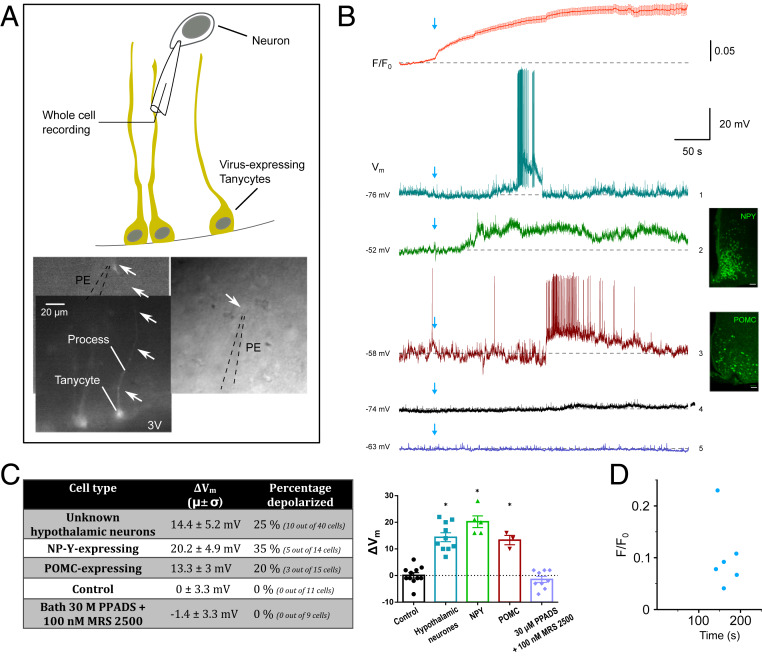
Fig. 4.
Optostimulation of tanycytes triggers depolarizing responses in arcuate nucleus neurons. (A) Schematic of the experimental design in acute brain slices expressing ectopic viral vectors (AdV-pTSHR-CatCh). The picture montage shows labeled tanycytes (eYFP fluorescence) with cell bodies and long processes. A recording was made from a neuron close to the end of the process (arrows; shown in bright-field images; PE, patch electrode). Recordings were made from neurons that were either close to the stained tanycytes (somata or processes) or close to the ependymal wall. Following establishment of recordings, the field of view was moved to ensure that the tanycyte cell bodies were exposed to blue light illumination. (B) Average (±SD) Rhod-2 Ca2+ imaging (red recording; n = 30) of tanycyte response to blue light optostimulation (indicated by the blue arrow; stimulation lasted for approximatively 15 s) in parallel with a whole-cell patch-current clamp recording from an arcuate neuron. Activation of tanycytes induced a current depolarization in close by hypothalamic neurons (turquoise recording 1; hypothalamic neurons). In some recordings, note the ramp depolarization evoked and burst of firing which was abruptly terminated. Similarly, in NPY-GFP–expressing animals, tanycyte activation induce a long current depolarization (green recording 2) as well as in POMC-GFP–expressing animals (red recording 3). (Scale bars, 50 μm.) Optostimulation had no effect on slices from control animals (black recording 4). In the presence of 100 nM MRS2500 (P2Y1 antagonist) and 30 μM PPADS (general P2 receptor blocker), optostimulation of tanycytes had no effect on the depolarization (purple recording 5). (C) The table summarizes the proportion of cells responding by a current depolarization after a tanycytic activation (average ± SD). Twenty-five percent of recorded neurons (10 out of 40 cells) responded. This induced on average a variation of the membrane potential for about 14.4 ± 5.2 mV. Similarly, 35% (5 out of 18 cells) of NPY- and 20% (3 out of 15 cells) POMC-expressing neurons showed a current depolarization, respectively, of 20.2 ± 4.9 and 13.3 ± 3 mV. We did not observe any change in membrane potential in control slices (from animals injected with a similar viral vector expressing GFP; 0.3 ± 3.4 mV). Bath application of a specific P2Y1 receptor antagonist (MRS2500) and a general P2 receptor blocker (PPADS) inhibited any membrane potential changes after tanycytic optostimulation (−1.4 ± 3.3 mV). The plot shows the variation between the baseline and at the peak of the depolarization of the membrane potential in each of the conditions (one-way ANOVA, P < 0.0001, followed by Tukey’s post hoc analysis, histogram shows mean ± SEM). (D) Plot of F/F0 vs. time of response in neurons (s). On average, neurons respond after 164.5 ± 21.5 s (average ± SD) with 0.1 ± 0.06 F/F0 (average ± SD).

