Fig. 3.
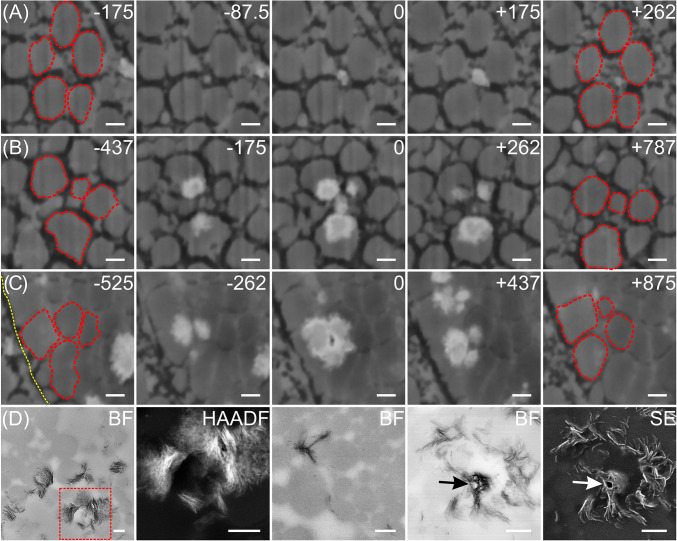
Series of FIB-SEM (A–C) and TEM images (D) showing spatial relationships between collagen fibrils (A–C, red outlines) and mineral deposits (white) in a distal region of an avian tendon. The FIB-SEM panels show different tissue regions in transverse profile in a single tendon specimen, prepared by HPF followed by AFS and staining with osmium tetroxide-uranyl acetate. Each FIB-SEM panel of five images represents mineralization occurring at different degrees at the specific locations imaged. A–C illustrate three sequences of mineralization events from sites in two different fibril bundles in the same tendon (A and B from the same bundle; C from a bundle different from that of A and B). Because all three sites are distinct within the same or different fibril bundles, A–C illustrate sequences of mineralization events that are spatially and temporally independent of each other. The panels represent various stages of mineral deposition based on increasing mineral content apparent in the images: An early stage (A), an intermediate stage (B), and a relatively more mature stage (C). Numbers at the Top Right corners of A–C represent the distance (in nanometers) of each image to the reference image (marked by 0) along the longitudinal direction of the collagen fibrils (the tendon long axis) in the specimen volume investigated. (A) Early stage mineral formation beginning and developing among five unmineralized collagen fibrils. The mineral in this sequence appears (image −87.5) in close association with a fibril(s) of small diameter located between five other fibrils of larger diameter, the mineral deposit(s) increases in size (image 0 and 175), and it gradually disappears (image 262) as the distance increases along the fibrils from the reference image (0). Because the association between the fibril(s) and mineral is not explicitly clear, it is difficult to determine whether these images illustrate intra- or interfibrillar mineralization or both processes. (B) Several mineral deposits appearing principally as intrafibrillar collagen mineralization. The intrafibrillar deposits occur at certain sites along the periphery of fibrils, only partially mineralizing them, and they do not form a shell of mineral about the fibril perimeter. As it grows and propagates from such sites, mineral changes in size and expanse with distance radially and along the fibrils (images −175, 0, and 262). The central deposit (image 0) would appear to define both intra- and interfibrillar mineralization. (C) A region of densely packed collagen fibrils illustrating a degree of intrafibrillar mineralization that reveals a small dark area, possibly a narrow channel, in the central interfibrillar space (image 0). The mineral deposits are predominantly intrafibrillar and they appear and disappear along the length of the several fibrils as at other sites (A and B). The yellow dotted line (image −525) represents the boundary of the collagen fibril bundle containing the fibrils of interest. (D) Brightfield (BF, far Left) and high angle annular darkfield (HAADF) images of a tendon sample prepared by chemical fixation. The images show mineral deposits principally surrounding collagen fibrils as viewed in transverse profiles. The HAADF image was obtained from the red-framed region of BF (far Left). The Middle BF image demonstrates intrafibrillar mineral deposits (black) spanning several collagen fibrils (gray). BF and SE images (panels 4 and 5, respectively, from the Left) show a possible channel (arrows) encircled by mineral in interfibrillar space. (Scale bar: 200 nm for all panels.)

