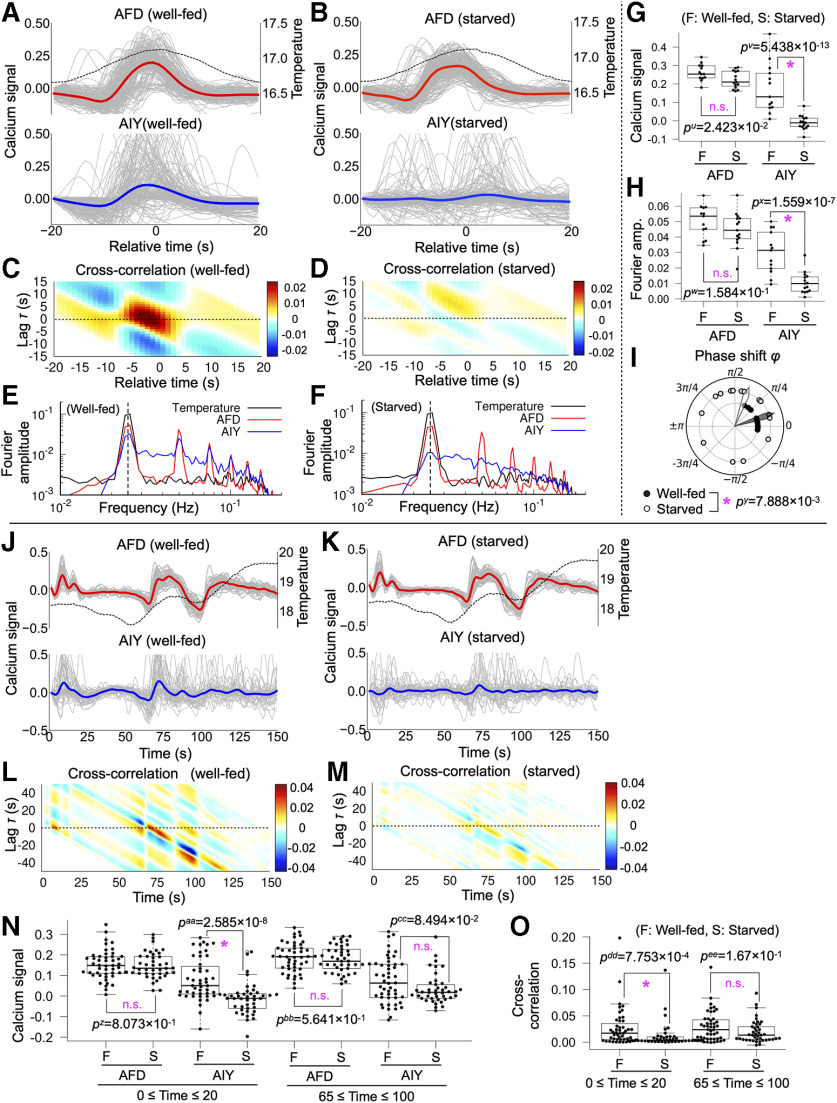
Figure 3.
AFD-AIY temporal interaction in response to thermal oscillation around 17°C (Osci17) and naturally fluctuated thermal stimuli (Fluc1719) was altered by starvation. A, AFD-AIY calcium responses of well-fed animals under thermal stimuli Osci17 (n = 13). Dashed black line indicates mean of the thermal stimuli. The gray lines indicate individual traces of calcium signals of AFD and AIY. The red and blue lines represent the mean of individual AFD and AIY signals, respectively. B, AFD-AIY calcium responses of starved animals under thermal stimuli Osci17 (n = 15). C, Cross-correlation function between AFD and AIY activities for well-fed animals. D, Cross-correlation function between AFD and AIY activities for starved animals. E, Fourier amplitude spectrum of temperature (black), AFD (red), and AIY activities (blue) observed in well-fed animals. Vertical dashed line represents frequency of thermal oscillation (0.025 Hz). F, Fourier amplitude spectrum of temperature (black), AFD (red), and AIY activities (blue) observed in starved animals. G, Differences in AFD and AIY calcium signals between well-fed and starved animals. Two datasets on the left: the results of AFD signals. Two datasets on the right: the results of AIY signals. Differences in AFD and AIY signals between well-fed and starved animals were tested for statistical significance by using Brunner–Munzel test; p values <0.05/3 = 0.0167 (1.67%) were considered statistically significant. Asterisk indicates p < 0.0167 (statistically significant), and n.s. indicates p ≥ 0.0167 (not significant). H, Differences in Fourier amplitude of AFD and AIY activities between well-fed and starved animals. Brunner–Munzel test was used for statistical analysis; p values <0.05/3 = 0.0167 (1.67%) were considered statistically significant. Asterisk indicates p < 0.0167 (statistically significant), and n.s. indicates p ≥ 0.0167 (not significant). I, Difference in phase shift between AFD and AIY responses. The black dots indicate phase shift between AFD and AIY responses for well-fed animals, and white dots are for starved animals. The black and white arrowheads represent mean directions of individual phase shift vectors for well-fed and starved animals, respectively. Mardia–Watson–Wheeler test was used for statistical analysis; p values <0.05/3 = 0.0167 (1.67%) were considered statistically significant. Asterisk indicates p < 0.0167 (statistically significant), and n.s. indicates p ≥ 0.0167 (not significant). J, AFD-AIY calcium responses of well-fed animals under thermal stimuli Fluc1719 (n = 48). Dashed black line indicates mean of the thermal stimuli. The gray lines indicate individual traces of calcium signals of AFD and AIY. The red and blue lines represent the mean of individual AFD and AIY signals, respectively. K, AFD-AIY calcium responses of starved animals under thermal stimuli Fluc1719 (n = 42). L, Cross-correlation function between AFD and AIY activities for well-fed animals. M, Cross-correlation function between AFD and AIY activities for starved animals. N, Differences in AFD and AIY calcium signals between well-fed and starved animals. Four datasets on the left: the results of AFD and AIY signals at 0 ≤ time ≤ 20 (18°C). The peak values of AFD signals and the values of AIY signals when AFD signals reach their peaks. Four datasets on the right: the results of AFD and AIY signals at 65 ≤ time ≤ 100 (18–18.5°C). Differences in AFD and AIY signals between well-fed and starved animals were tested for statistical significance by using Brunner–Munzel test; p values <0.05/2 = 0.025 (2.5%) were considered statistically significant. Asterisk indicates p < 0.025 (statistically significant), and n.s. indicates p ≥ 0.025 (not significant). O, Difference in the cross-correlation function between well-fed and starved animals. Four datasets on the right, Cross-correlation at 0 ≤ time ≤ 20 (18°C). Four datasets on the right, Cross-correlation at 65 ≤ time ≤ 100 (18°C). Brunner–Munzel test was used for statistical analysis; p values <0.05/2 = 0.025 (2.5%) were considered statistically significant. Asterisk indicates p < 0.025 (statistically significant), and n.s. indicates p ≥ 0.025 (not significant).

