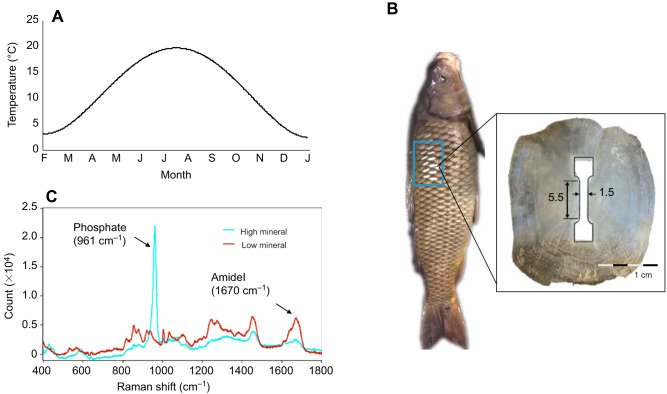
Fig. 2.
Schematic descriptions for specimen preparation and evaluation. (A) Approximation of the annual temperature cycle (2017–2018) for the Columbia River at the PNNL Aquatic Research Laboratory. The line was fit to the mean monthly temperatures by least squares regression. (B) Sectioning of the tensile specimens and location for microstructure evaluation. (C) Representative Raman spectrum with labeling of the phosphate and amide I peaks indicated at 961 and 1690 cm−1, respectively.

