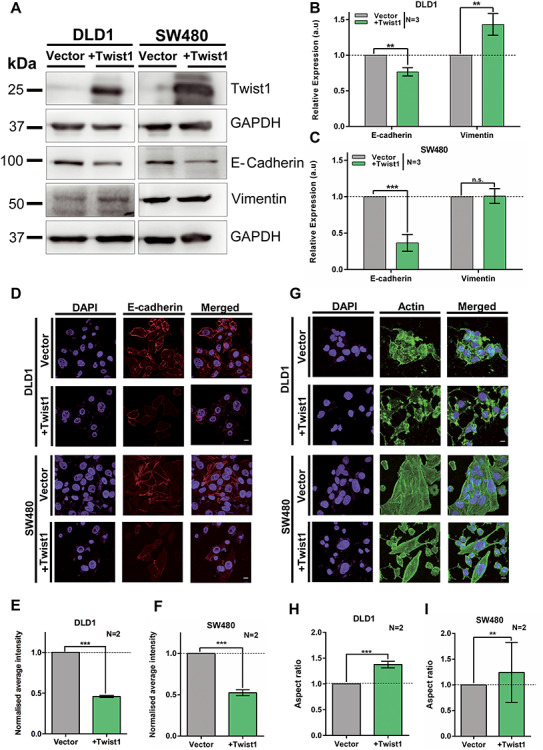
Figure 1.

Differential induction of EMT upon Twist1 overexpression in colorectal cancer cells. (A) Representative immunoblot showing Twist1 overexpression with a concomitant decrease in E-cadherin and marginal increase in Vimentin levels in DLD1 and SW480 cell lines. (B and C) Quantification of band intensities of E-cadherin and Vimentin protein levels in DLD1 and SW480 cell lines upon Twist1 overexpression. Data from three independent biological replicates normalized to GAPDH (unpaired t-test, N = 3, mean ± SD, *P < 0.05, **P < 0.01, ***P < 0.001 and ****P < 0.0001). (D) Representative mid-optical sections from confocal z-stacks of DLD1 and SW480 cells immunostained for E-cadherin, scale bar ~10 μm. (E and F) Normalized fluorescence intensity of E-cadherin for vector and Twist1 overexpressing cells. Data from two independent biological replicates for DLD1 and SW480, respectively, (Mann–Whitney test, N = 2, n > 60, mean ± SD, *P < 0.05, **P < 0.01, ***P < 0.001 and ****P < 0.0001). (G) Immunostaining for actin showing an elongated and spindle-shaped morphology upon Twist1 overexpression, scale bar ~10 μm. (H and I) Quantification of aspect ratio of cells (Mann–Whitney test, N = 2, n > 40, mean ± SD, *P < 0.05, **P < 0.01, ***P < 0.001 and ****P < 0.0001). N: number of independent biological replicates, n: number of cells.
