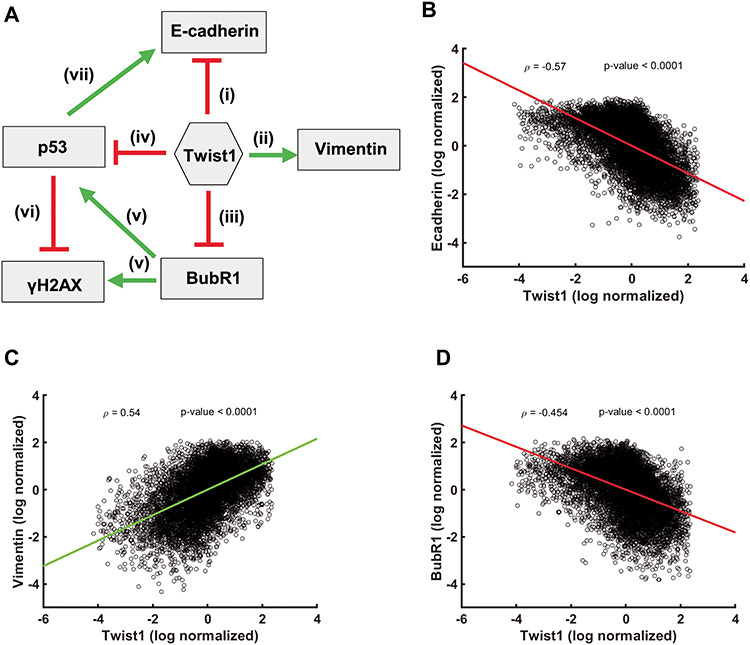
Figure 5.

Correlation between levels of Twist1, EMT and CIN factors. (A) Network depicting the interactions among Twist1, EMT and CIN genes. Correlation plots of the log normalized gene expression values of (B) Twist1 and E-cadherin (C) Twist1 and Vimentin (D) Twist1 and BubR1, ρ = Pearson correlation coefficient, P-values show the significance of Pearson correlation.
