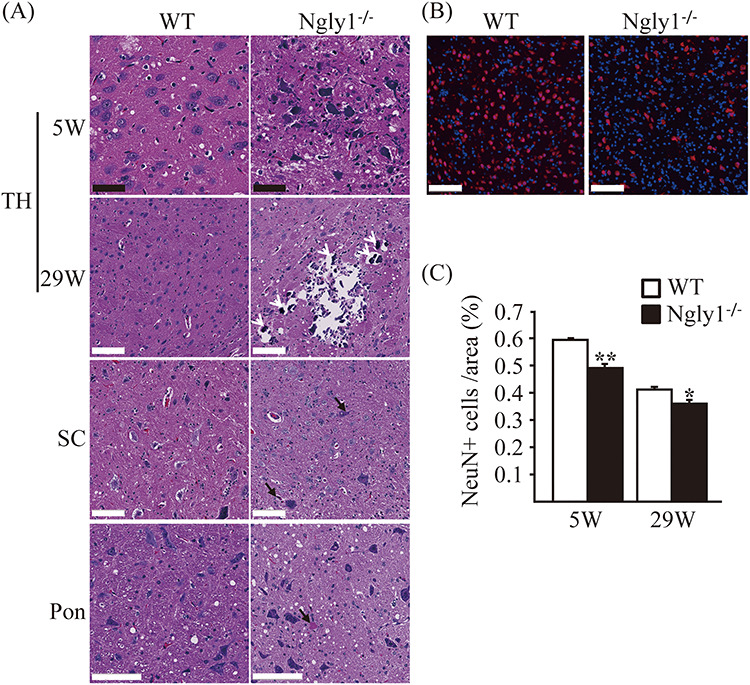
Figure 4.

Neuronal degeneration in the central nervous systems of Ngly1−/− rats. (A) H&E-stained sections of the thalamus (TH), spinal cords (SC) and pons from Ngly1−/− and the WT rats at 5 and 29 weeks of age. Black arrows indicate intra- and extracellular eosinophilic inclusion bodies and white arrows indicate mineralization. Black scale bar 50 μm, white scale bar 100 μm. (B) Immunohistochemistry of thalamus from Ngly1−/− and the WT rats at 5 weeks of age, stained with an anti-NeuN, a mature neuron marker (red). Nuclei were stained with DAPI. Scale bar 100 μm. (C) The number of NeuN-positive cells in VPM/VPL, VM and VL regions of the thalamus in Ngly1−/− and the WT rats at 5 and 29 weeks of age. Values represent mean ± SEM (n = 6–10). Asterisks indicate *P < 0.05 and **P < 0.01.
