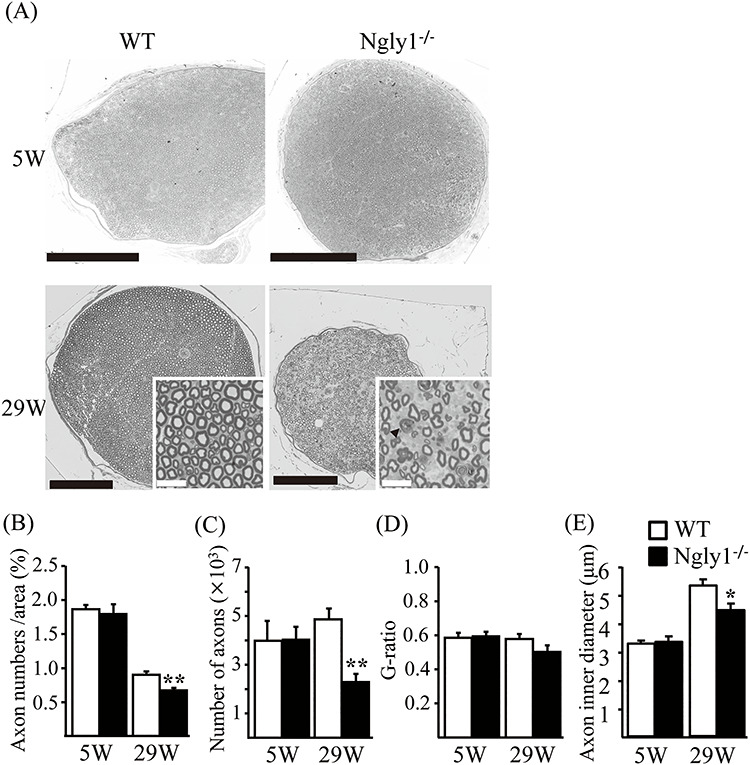
Figure 5.

Axonal degeneration of older Ngly1−/− rats. (A) Toluidine-blue-stained plastic semi-thin sections of sciatic nerve of Ngly1−/− rats and WT rats at 5 or 29 weeks of age. Arrows indicate the myelin ovoid. Black scale bar 250 μm, white scale bar 25 μm. (B–E) Quantification of total number of axons (B), the density of axons (C), g-ratio (D) and average axon inner diameter (E) per nerve. Values represent mean ± SEM (n = 5–10). Asterisk, **P < 0.01, *P < 0.05 (Student’s t-test).
