
Figure 1.
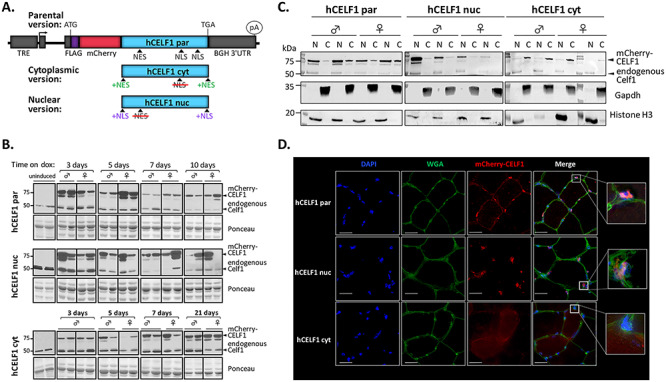
Modified CELF1 proteins show distinct cellular localization. (A) Diagram of transgenes for inducible expression of differentially localized CELF1. In the parental construct (hCELF1par), human CELF1 is unmodified, with natural nuclear localization (NLS) and export signals (NES) indicated (top). The cytoplasmic (hCELF1cyt) and nuclear (hCELF1nuc) constructs contain the changes shown and described in the text. (B) Adult bitransgenic mice, hCELF1/MDAF, hCELF1nuc/MDAF and hCELF1cyt/MDAF, were induced to express mCherry-CELF1 for the times indicated. Western blotting for CELF1 detects endogenous and exogenous CELF1 and determines the level of mCherry-CELF1 expression. Ponceau stain (bottom) shows total protein loading. The expected sizes of mCherry-CELF1 and endogenous Celf1 are 81 and 52 kDa, respectively. For each line and time point, n = 4–7 males and 4–7 females per genotype, representative animals are shown from each. (C) Isolation of nuclear and cytoplasmic proteins from quadriceps of animals induced for 3 days shows enhanced nuclear expression of mCherry-CELF1 in the hCELF1nuc line and enhanced cytoplasmic expression in the hCELF1cyt line. N, nuclear fraction; C, cytoplasmic fraction. (D) Representative fluorescence images from transgenic animals induced to express the mCherry-CELF1 fusion construct for 7 days. Images are of mCherry epifluorescence (red) from frozen sections of tibialis anterior and were stained for wheat germ agglutinin to outline cell boundary (green). Scale bar, 25 μm.