
Figure 3.
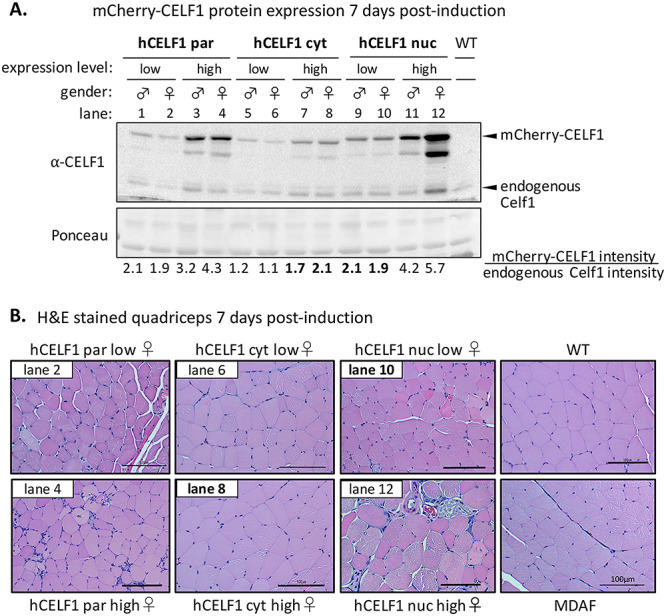
A comparison of low and high expressing animals from mCherry-CELF1 transgenic lines highlights pathology associated with overexpression of nuclear CELF1. Adult hCELF1par, hCELF1nuc and hCELF1cyt mice and WT controls were given dox-containing chow for 7 days. (A) Total protein was isolated from quadriceps of mice expressing high and low amounts of mCherry-CELF1 from each line. WT control littermates do not express mCherry-CELF1 protein. Ponceau stain (bottom) shows total protein loading. The expected sizes of mCherry-CELF1 and endogenous Celf1 are 81 and 52 kDa, respectively. The levels of mCherry-CELF1 were normalized to the levels of endogenous Celf1 to determine fold increase. (B) H&E staining of formalin-fixed, paraffin-embedded quadriceps from the female bitransgenic mice shown in A and indicated by lane number. hCELF1par and hCELF1nuc animals expressing low levels of mCherry-CELF1 (comparable to hCELF1cyt high expressing animals) show signs of histological defects. High and low expressing hCELF1cyt animals show normal skeletal muscle histology. Scale bar, 100 μm.