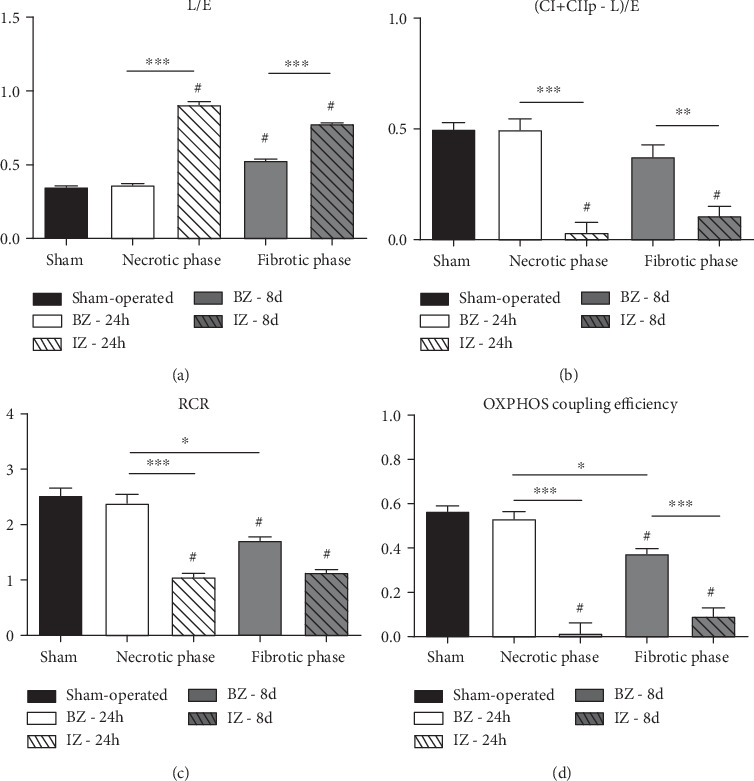
Figure 4.

Oxygen flux control ratios (FCR), respiratory control ratio (RCR), and OXPHOS coupling efficiency from the Sham group and rats subjected to AMI (PBS group). Functional parameters were obtained/calculated as described in High-Resolution Respirometry. Data represent the mean ± SEM values. Groups (indicated on the abscissae) and n were those described in the legend in Figure 3. #P < 0.05 with respect to Sham; for comparisons within the 4 BZ and IZ subgroups, the levels of significance are as follows: ∗P < 0.05, ∗∗P < 0.01, and ∗∗∗P < 0.001 (1-way ANOVA with Bonferroni's posttest).
