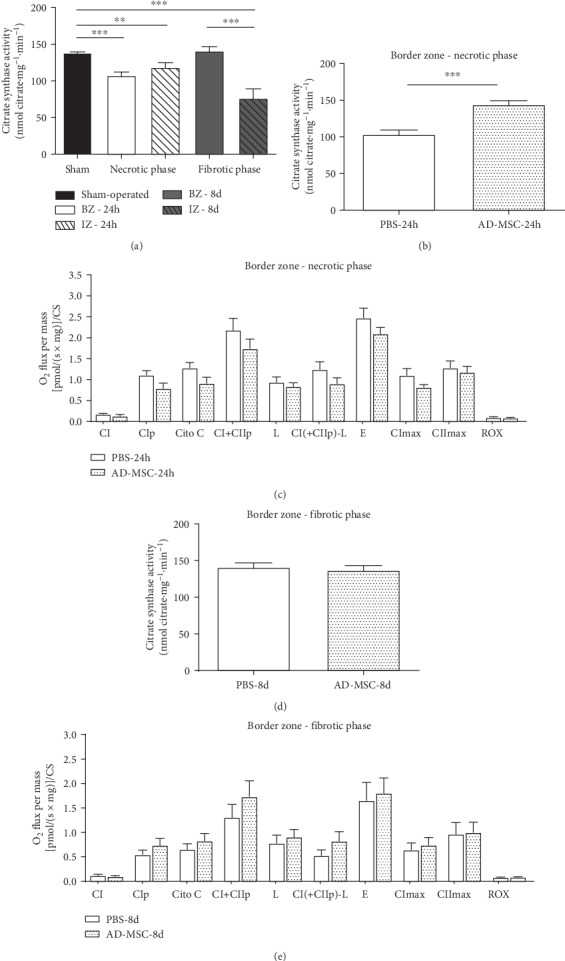
Figure 5.

Citrate synthase activity measured in cardiac muscle fibers homogenates and oxygen flux in respirometry experiments normalized to CS activity. The activity is expressed in nmol citrate·mg−1·min−1 and O2 flux by [pmol/(s·mg)]/CS. (a) CS activity from the Sham group and rats subjected to AMI (PBS group). Groups are indicated on the abscissa where white bars represent BZ during the necrotic phase (white) and fibrotic phase (gray) and dashed bars represent IZ during the necrotic phase (white) and fibrotic phase (gray). The number of animals in each group was as follows: Sham group, n = 14; PBS-24 h group, n = 8; and PBS-8 d group, n = 7. (b) CS activity comparing the PBS (n = 8) and AD-MSC treatment groups (n = 7) in the BZ during the necrotic phase and (d) fibrotic phase (PBS-8 d, n = 7; AD-MSC-8 d group, n = 8). (c) Mitochondrial functional parameters showing O2 flux normalized to CS activity comparing the PBS group and AD-MSC group in the BZ during the necrotic phase and (e) fibrotic phase. n of samples were those described in Table 1. Data represent the mean ± SEM values. ∗∗P < 0.01 and ∗∗∗P < 0.001 (1-way ANOVA with Bonferroni's posttest). To compare the treated and nontreated groups, an unpaired t-test was used (graphs in (b)–(e)).
