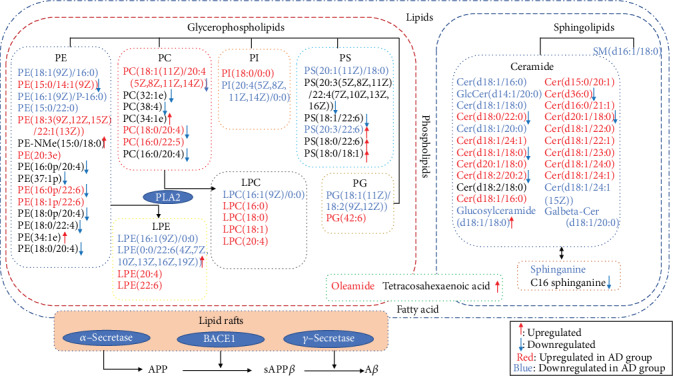
Figure 7.

Lipid metabolism pathway map depicts the pathomechanism in AD rats and the therapeutic mechanism of BSTSF for AD. Notes: the red and blue letters indicate that the lipids were upregulated or downregulated, respectively, in group AD compared with group sham. The red upward arrow and blue downward arrow indicate that the lipids were upregulated or downregulated, respectively, by BSTSF.
